
Following a busy week of results, around 90% of the ASX 300 has now reported, with this being the final week of the August 2025 reporting season.
In line with our pre-reporting season expectations, earnings delivery has been crucial given full valuations and high market expectations, with weaker-than-expected results typically being punished by the market.
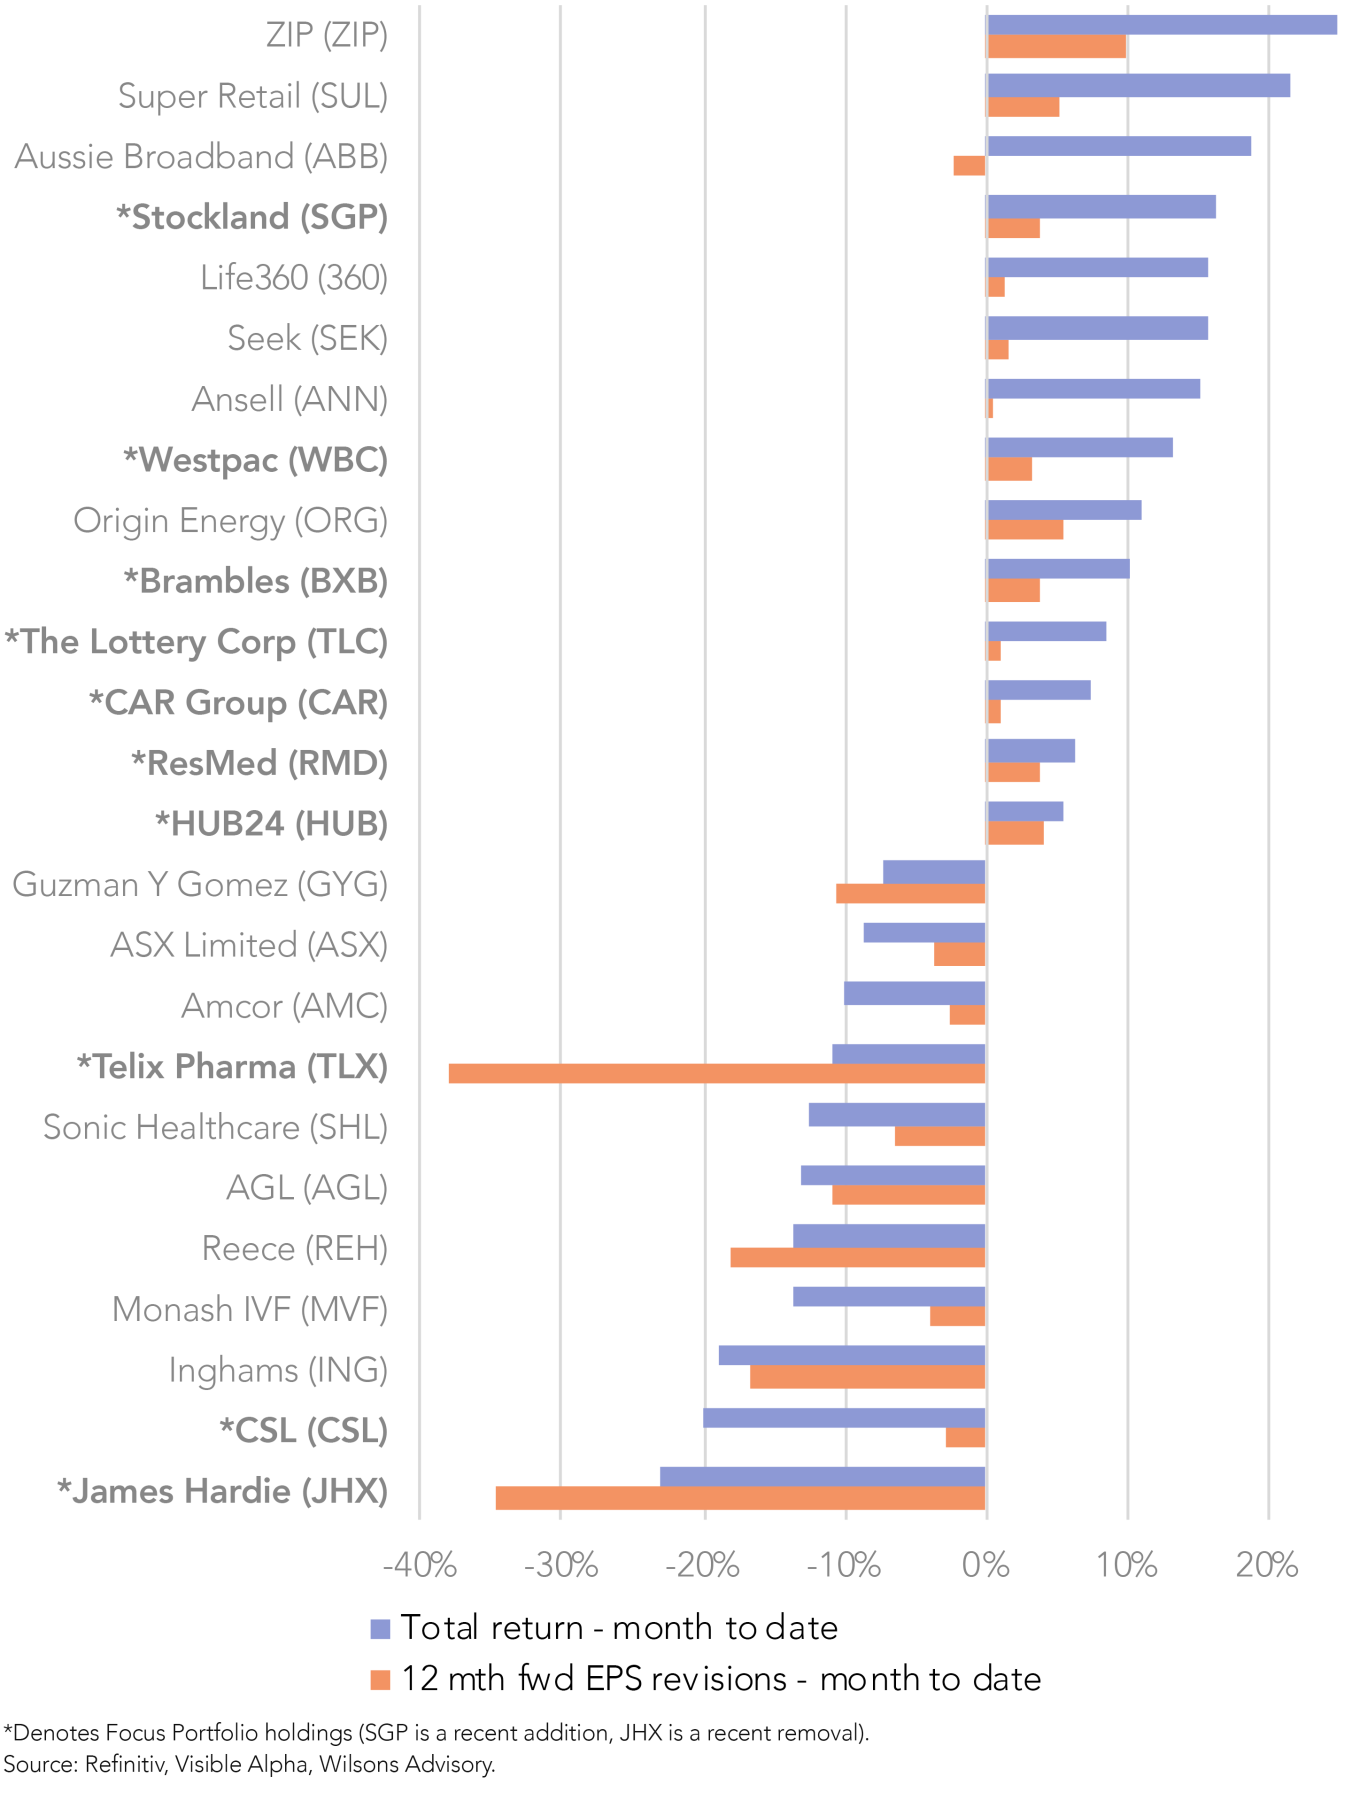
Over the past week in particular, several companies released disappointing earnings updates and outlook statements and have sold off sharply. The most notable examples are index heavyweights CSL and James Hardie, which have fallen -21% and -26% this month-to-date, respectively.
On the other hand, plenty of companies have met or beat expectations in their results and have been rewarded by the market, including Brambles, The Lottery Corp, Stockland, Aussie Broadband, Ansell, ZIP, Super Retail, Life360 and Seek, among others.
In this report, we review ‘the good, the bad and the ugly’ from the past week of reporting and provide the rationales for recent changes to the Focus Portfolio. Specifically, we discuss in detail:
- The Good: Stockland (new portfolio addition)
- The Bad: CSL (portfolio weight reduced)
- The Ugly: James Hardie (removed from portfolio)
We have also increased the portfolio’s weightings towards Goodman Group, ResMed, and Pinnacle Investment Management, reflecting our high level of conviction in each of these businesses following their respective results.
A full summary of Focus Portfolio results to date is also provided in Figure 12, including results from the past week not discussed in detail in this report – specifically, stronger-than-expected results from The Lottery Corp and Brambles, as well as results from Telix Pharmaceuticals, Goodman Group, Santos, and Northern Star Resources.
| Company | Ticker | Focus Portfolio weight | +/- | |
| Pre changed | Post changes | |||
| Stockland | SGP | - | 3.0% | 3.0% |
| Pinnacle Investment | PNI | 2.0% | 3.5% | 1.5% |
| Goodman Group | GMG | 4.0% | 5.5% | 1.5% |
| ResMed | RMD | 4.0% | 5.0% | 1.0% |
| James Hardie | JHX | 3.0% | - | -3.0% |
| CSL | CSL | 8.0% | 4.0% | -4.0% |
Source: Wilsons Advisory.
The Good
Stockland (SGP) – strong residential momentum into FY26
SGP has been added to the Focus Portfolio at a 3% weight.
We have previously flagged SGP as the A-REIT offering the greatest exposure to Australia’s housing market recovery, which was reflected in its strong FY25 result.
Read A-REITs: Rate Cuts Lay a Solid Foundation
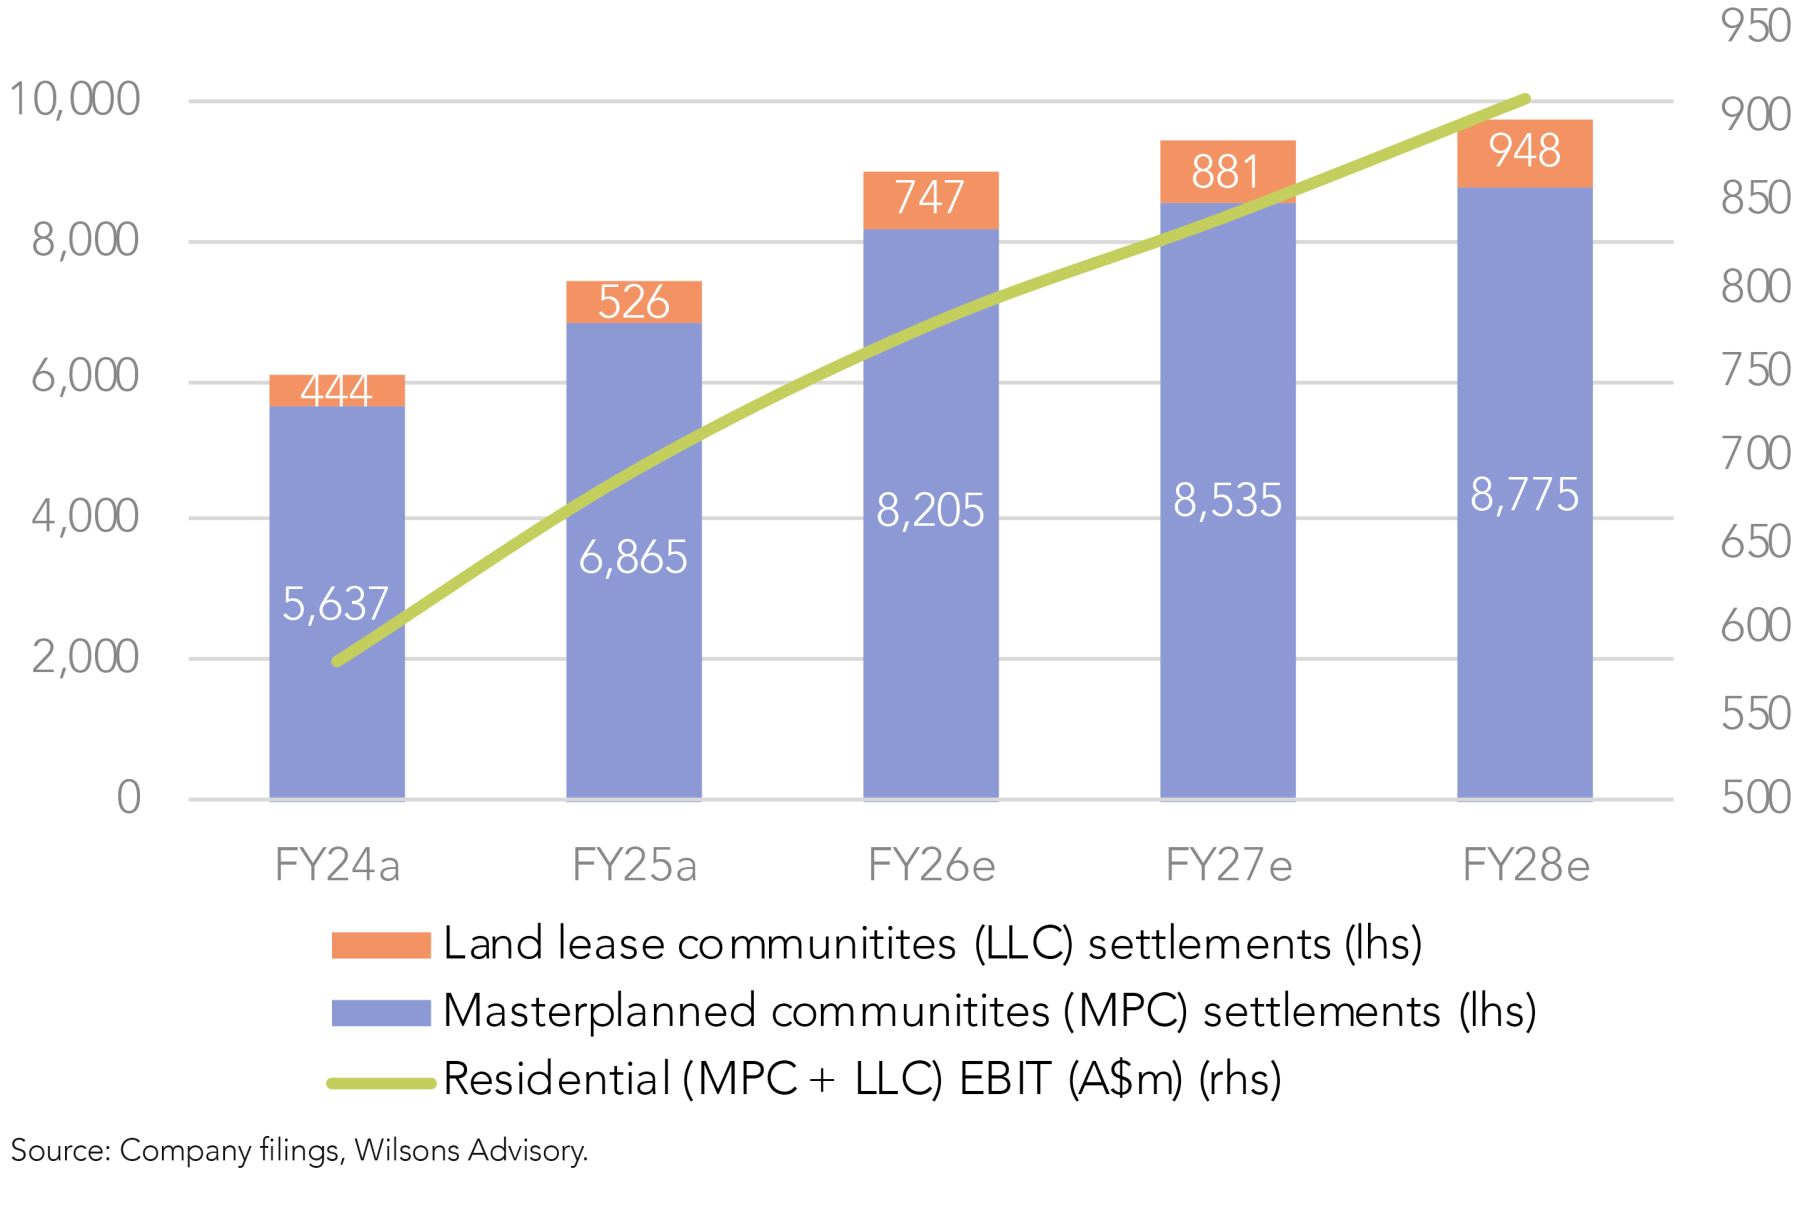
In FY25, SGP generated FFO (funds from operations) of 33.9cps (+2.7% YoY), which was slightly ahead of consensus of 33.3cps. The highlight of the result was SGP’s master-planned communities (MPC) settlements, which grew +22% YoY to 6.87k, comfortably above guidance of 6.2k-6.7k lots.
Management demonstrated its preference towards organic funding, with the combination of a lower dividend payout ratio (reduced from 75-85% to 60-80%), an active dividend reinvestment plan, and continued capital partnering.
Guidance for FFO of 36-37cps in FY26 implies 6-9% growth YoY, and management flagged it expects MPC settlements of 7.5-8.5k, which at the mid-point is 3% above consensus.
Overall, SGP’s positive result and guidance demonstrates strong execution from its MPC business, with positive momentum into FY26 highlighting that LendLease Communities has been integrated successfully, and that a residential recovery is well underway.
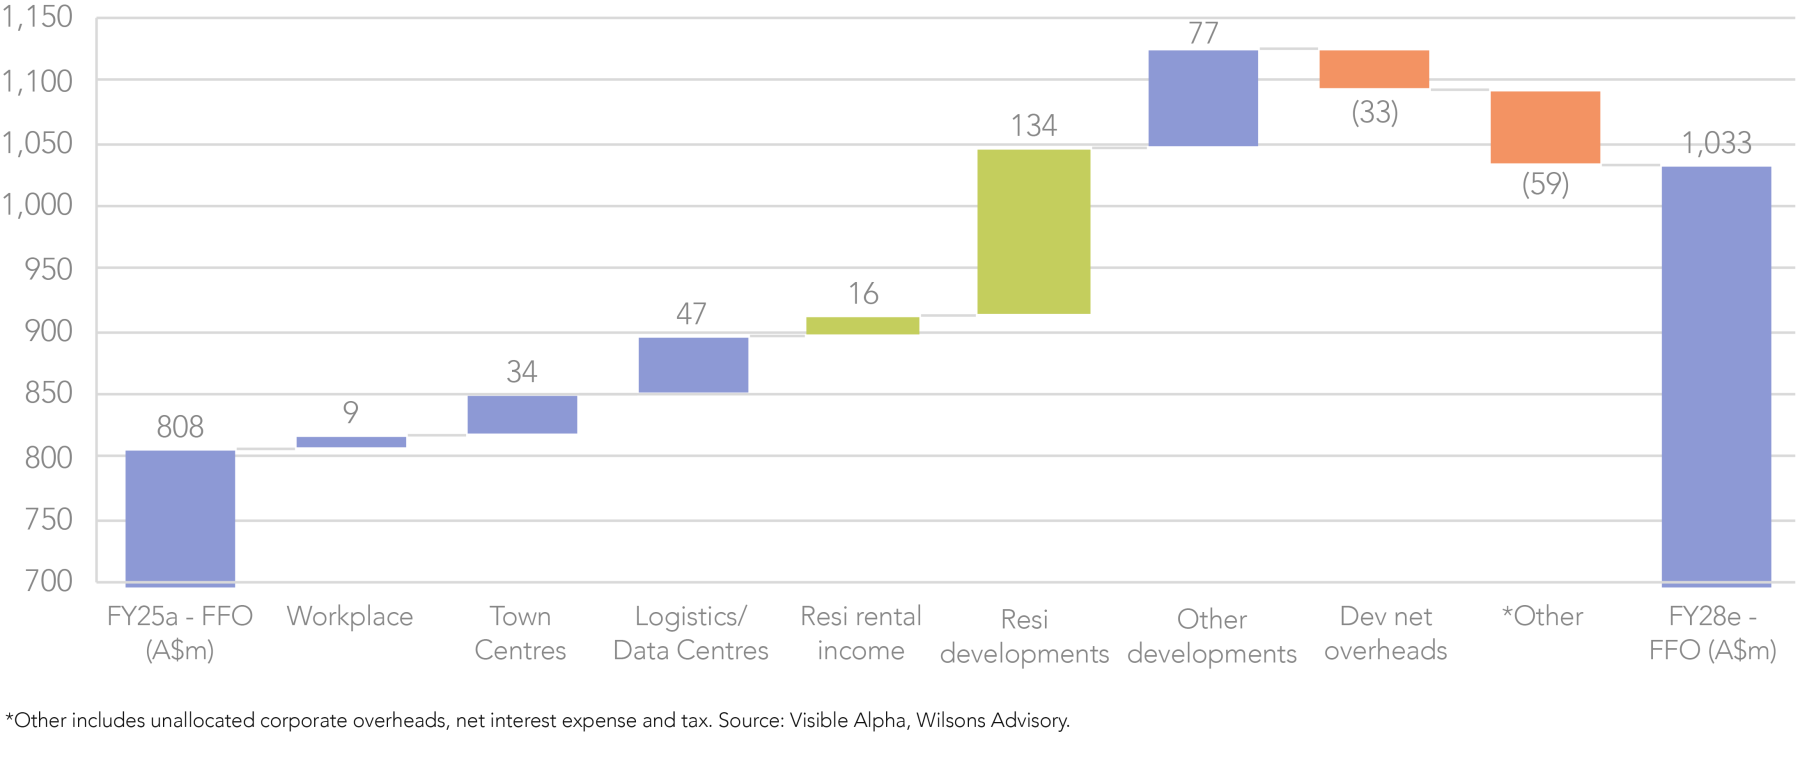
Lastly, the result highlighted that SGP's portfolio quality and growth profile has improved markedly in recent years, with its largest FFO contributor now being residential (~55% of FY25 FFO), followed by town centres (~25%), and logistics/data centres (~15%) (including a new 100MW JV with EdgeConneX).
Attractive leverage to an improving housing market
SGP is leveraged to the positive outlook for Australian housing. The group has a substantial residential pipeline of ~90.8k lots with an end value of $56bn, diversified across single family housing communities and, more recently, apartments.
In line with our view, SGP points to house price and volume growth over the next twelve months across the Eastern Seaboard (NSW, VIC and QLD), supported by pent-up demand, interest rate cuts, government incentives supporting first home buyers and tight supply (particularly in NSW and QLD).
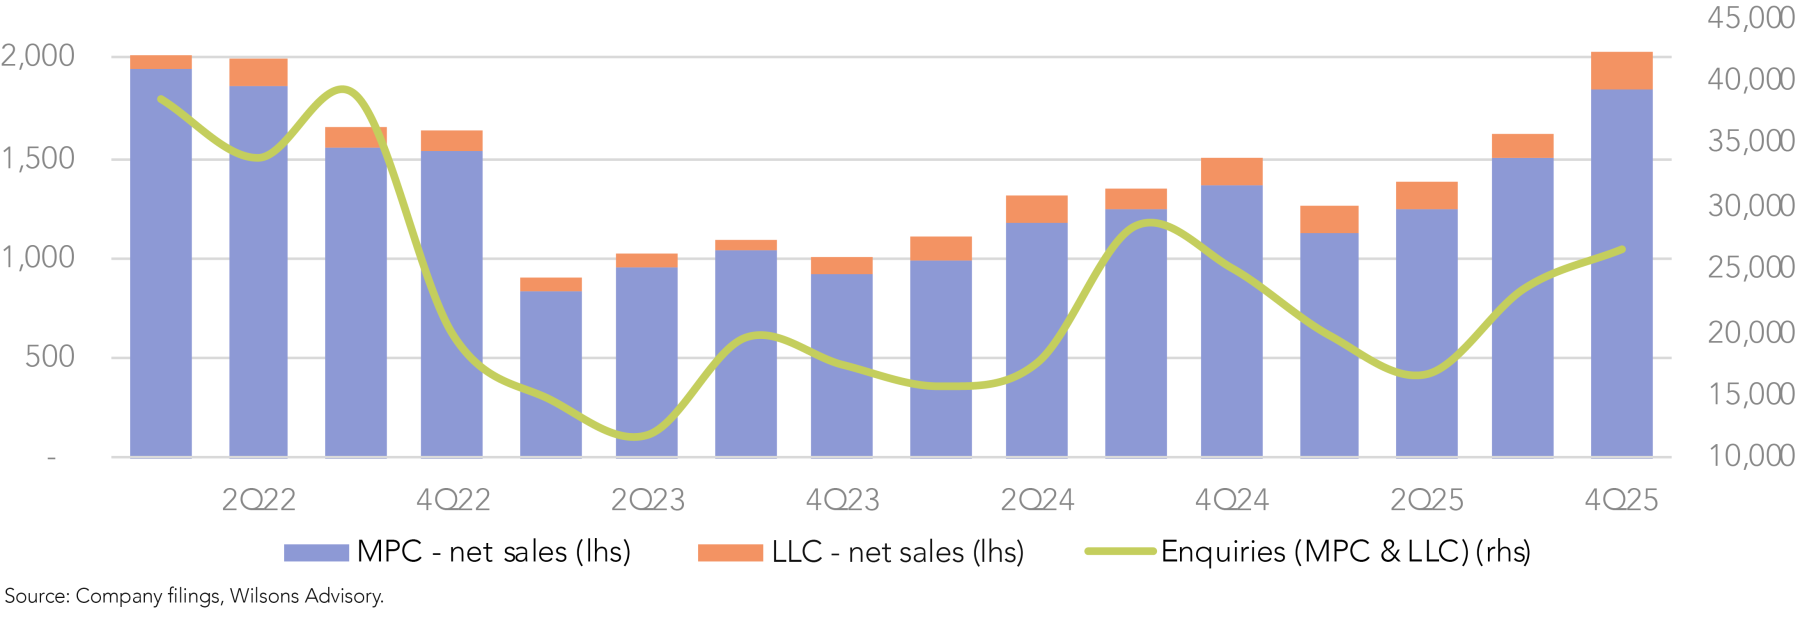
With key forward indicators – including Q4 sales, enquiries and contracts on hand – showing positive momentum into FY26, we expect SGP to be a material beneficiary of an acceleration in house prices and turnover over the medium-term.
SGP offers attractive value at a forward P/E and price/FFO of 17x (FFO is the REIT sector’s preferred measure of cash flows), the latter of which is slightly below the ASX 200 A-REIT average of 18x. This is despite SGP’s superior growth outlook, with a three year (FY25-28) FFO/EPS CAGR of 9% (with upside risks from housing tailwinds), compared to the sector average of 5%.
The Bad
CSL Limited (CSL) – Behring blood bath
Focus Portfolio weight reduced from 8% to 4% (neutral vs ASX 300).
In our reporting season preview, we flagged that ‘another earnings miss/downgrade would place greater pressure on CSL’s margin recovery narrative and cast doubt over the achievability of current consensus forecasts’ and ‘may prompt a reassessment of our conviction in the business’.
Read Reporting Season Preview — Little Room for Error
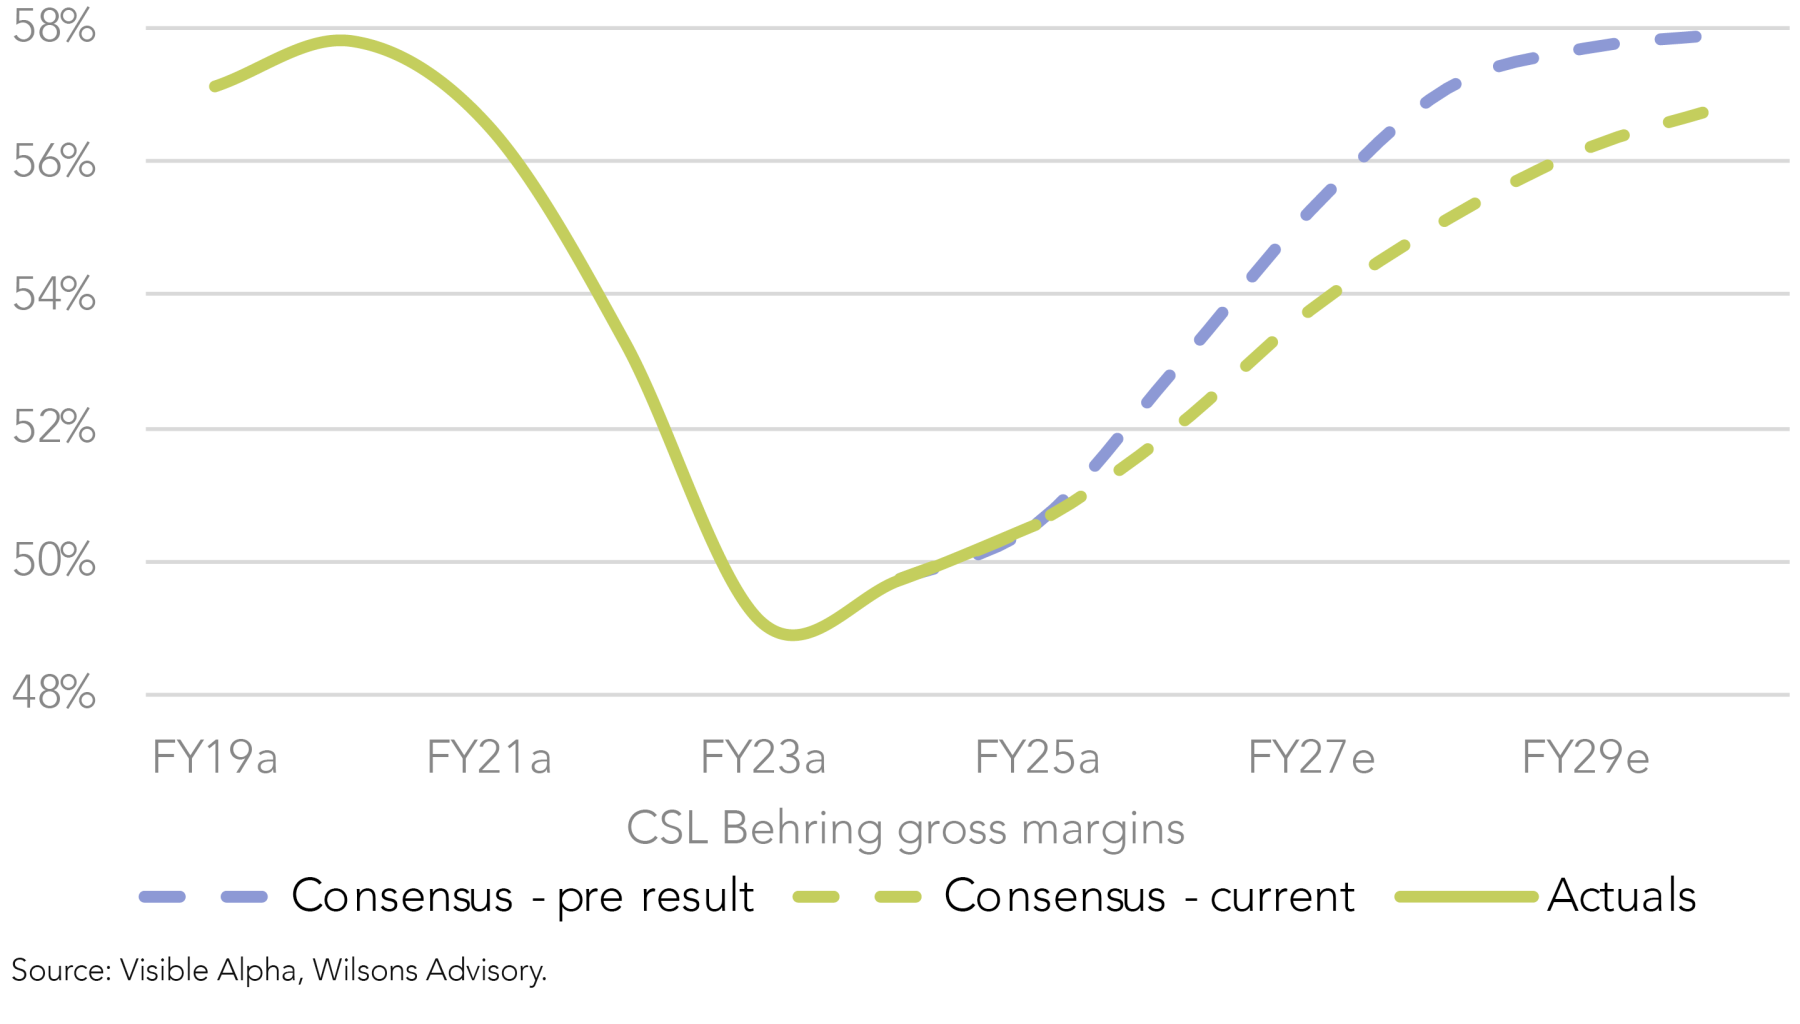
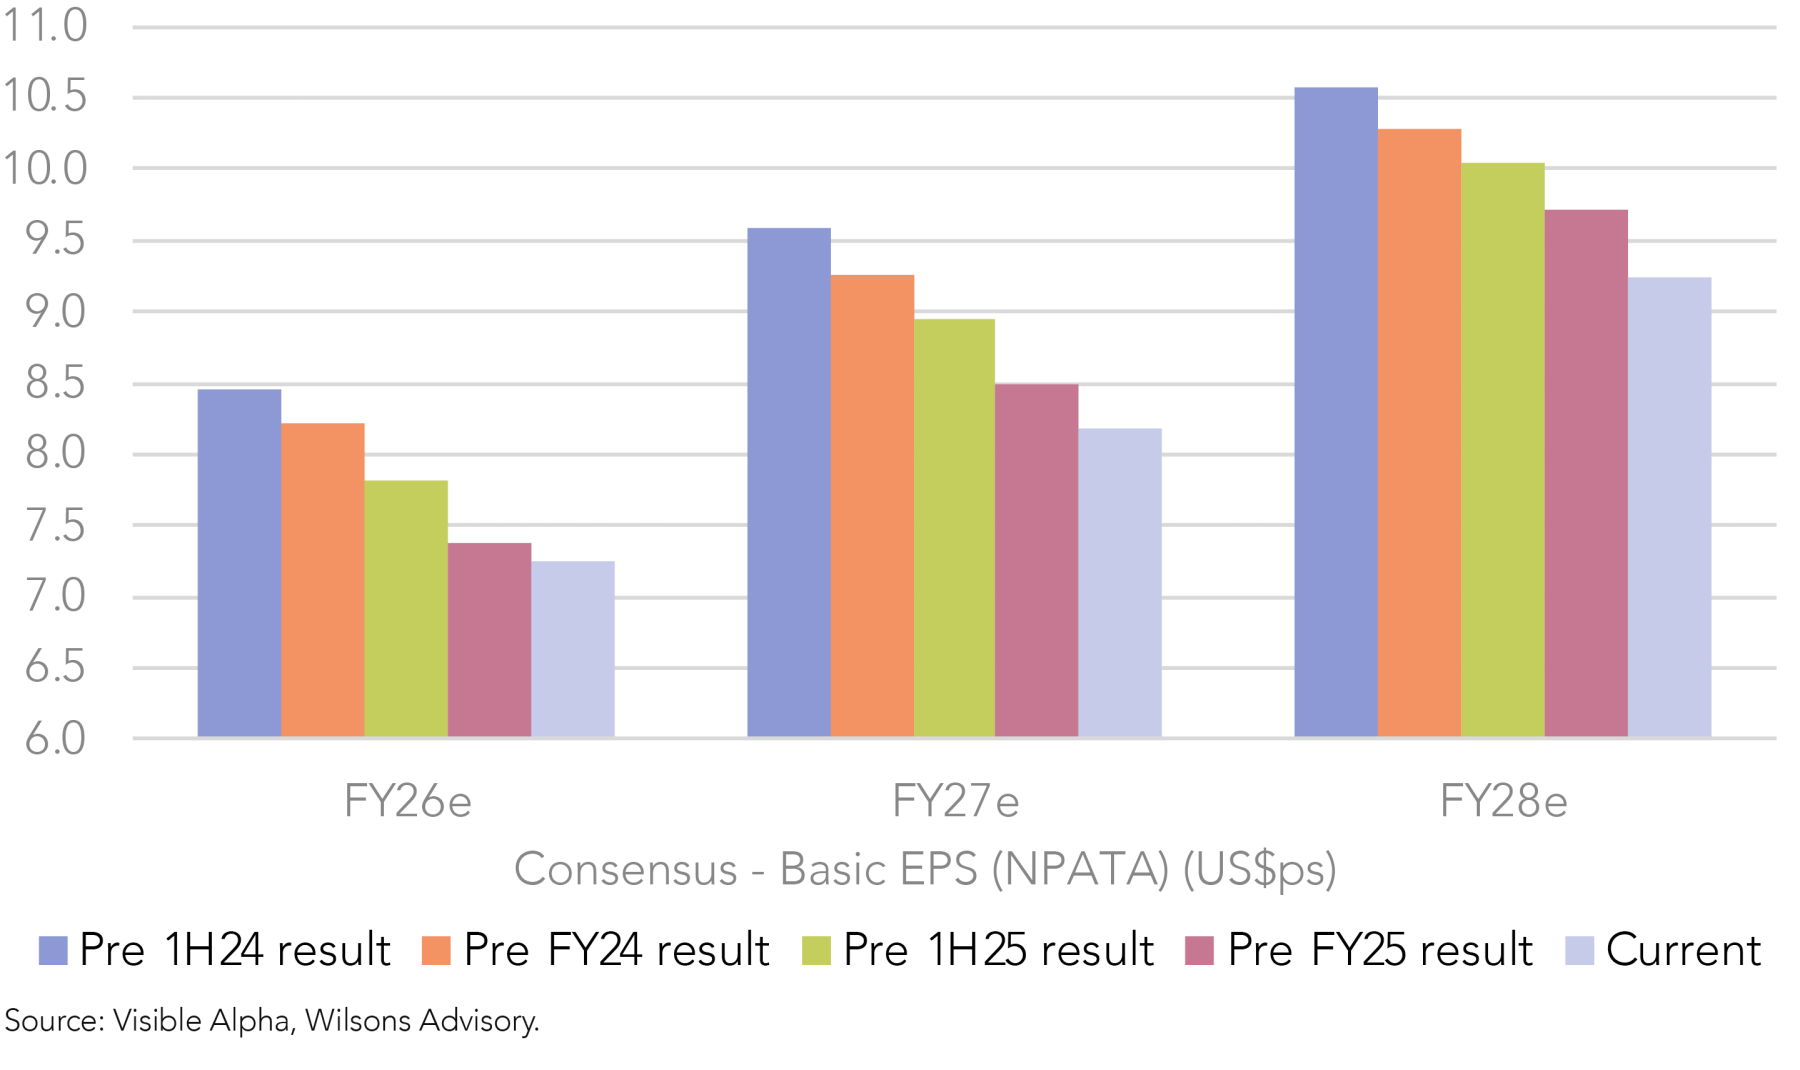
Disappointingly, CSL has once again not delivered against our expectations. CSL’s FY25 result was a very low quality NPATA beat (driven by lower R&D and tax expenses), while its guidance was weak. FY26 guidance is for NPATA growth of 7-10%, which at the mid-point is below consensus (+9%), despite excluding US$700-770m of restructuring costs and including some initial cost-out benefits. Since the result, FY26e consensus EPS (NPATA) has been downgraded by 4%.
The most disappointing element was the -8% EBITDA miss by Behring – long regarded as CSL’s growth engine – driven by weakness in IG sales. Furthermore, management’s decision to abandon the timeline for Behring’s gross margin recovery, which has been central to CSL’s medium-term EPS growth outlook, has undermined our investment thesis.
We also have concerns that management’s decisions to embark on major structural changes - including a cost-out/restructure and plans to spin off Seqirus, suggest the group faces an increasingly challenging outlook. As a result, given we have lost conviction in both management and CSL’s medium-term earnings growth trajectory, we are taking this opportunity to reduce our exposure to CSL from overweight to neutral.
CSL appears reasonably valued at a forward PE of ~19x, with a three-year consensus EPS CAGR of 12. However, we are cautious about the growth outlook, given continued negative consensus earnings momentum following successive downgrades. In combination, these considerations warrant a neutral portfolio exposure.
Read our first take on CSL’s result in Reporting Season Update – The Beginning of a Big 4 Banks Rotation?
The Ugly
James Hardie (JHX) – Crumbling foundations
JHX has been removed from the Focus Portfolio
JHX’s 1Q26 update was significantly worse than expected. In Q1, EPS fell -59% to 15cps, well below prior consensus forecasts of 36cps, which were looking for flat EPS compared to Q1 FY25 rather than a significant decline.
Management also updated its guidance, incorporating three quarters contribution from AZEK, pointing to EBITDA of $1.05-1.15bn in FY26, which is ~15-20% below prior consensus estimates (on a like-for-like basis). Previously, JHX guided towards flat-to-low single digit growth in North American volumes. However, the latest guide implies mid double digit declines for the legacy sidings business (ex AZEK) – a substantial lowering of expectations in just a three-month period.
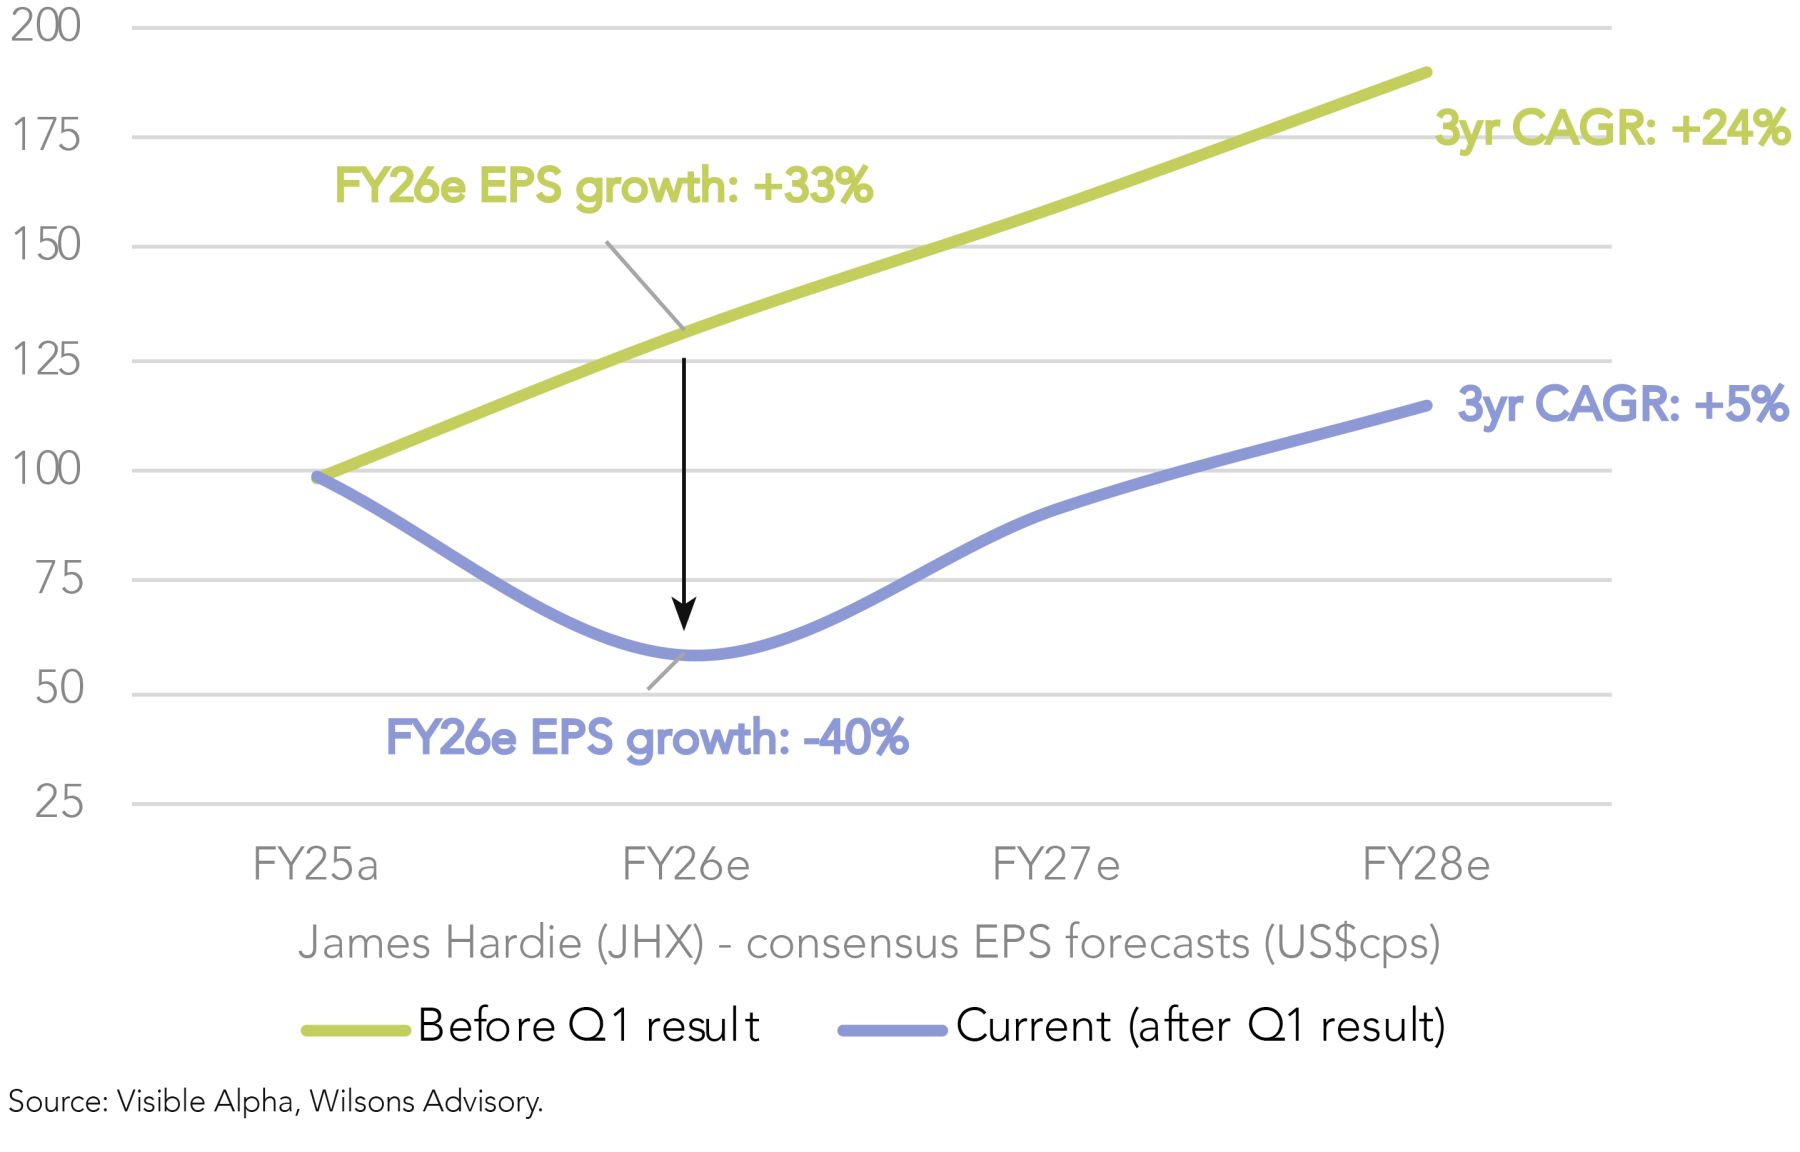
The weaker guidance has translated to dramatically lower consensus EPS, with estimates now implying a -40% YoY EPS decline in FY26, compared to previous expectations of +33% YoY growth. JHX’s consensus three-year EPS CAGR (FY25-28) has fallen from +24% to +5%, and we see further downside risks amidst the rapidly deteriorating market backdrop.
The cycle is getting worse, not better…
This is a thesis break for our position in JHX. Our investment thesis was based on our expectations of a cyclical recovery in JHX’s earnings over FY26/27, driven by improvements in its key North American segment, as US construction activity improved following US interest rate cuts.
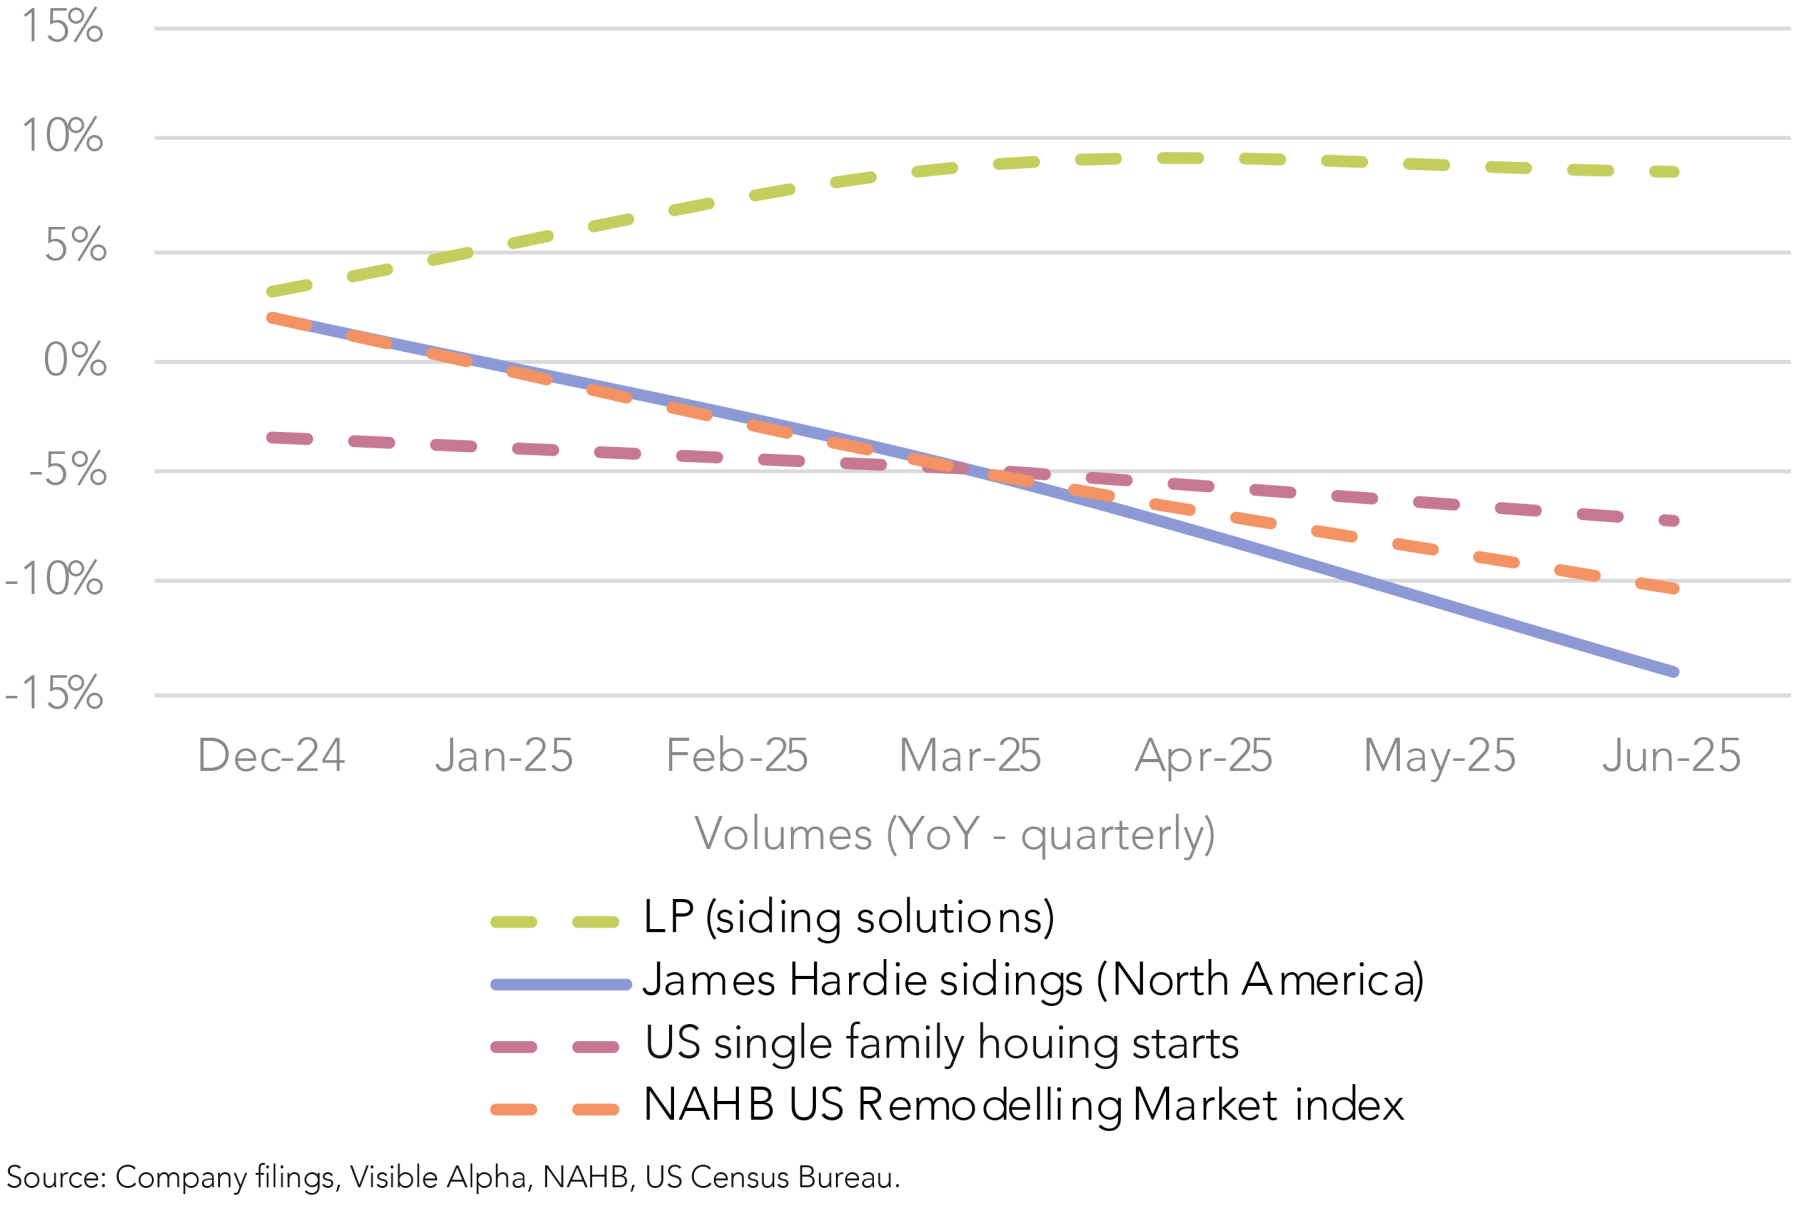
However, US housing market activity for both new builds and remodelling work continues to deteriorate, contrary to our prior expectations. We put this down to a range of factors: US tariff volatility and policy uncertainty (e.g. Trump’s undocumented worker deportation push) are weighing on builder confidence which has fallen to three year lows; US mortgage rates remain stubbornly elevated around 7% despite rate cuts (reflecting the long end of the yield curve); and lastly, significant ongoing affordability challenges, which are constraining building materials demand (particularly for premium sidings).
We also have concerns that JHX may be losing market share in the US. While management has indicated it is holding its market position against competitors and has pointed to channel destocking as a reason for the sharp decline in Q1, we note JHX has underperformed the North American sidings volumes growth achieved by key US peers, including Louisiana Pacific (LP) and TREX.
Accordingly, we no longer have confidence that JHX will return to above-market EPS growth over the medium-term. The severity of this downgrade also raises questions around management’s level of visibility into current market dynamics and its commitment to its continuous disclosure obligations.
Stretched balance sheet raises the risk of a capital raise
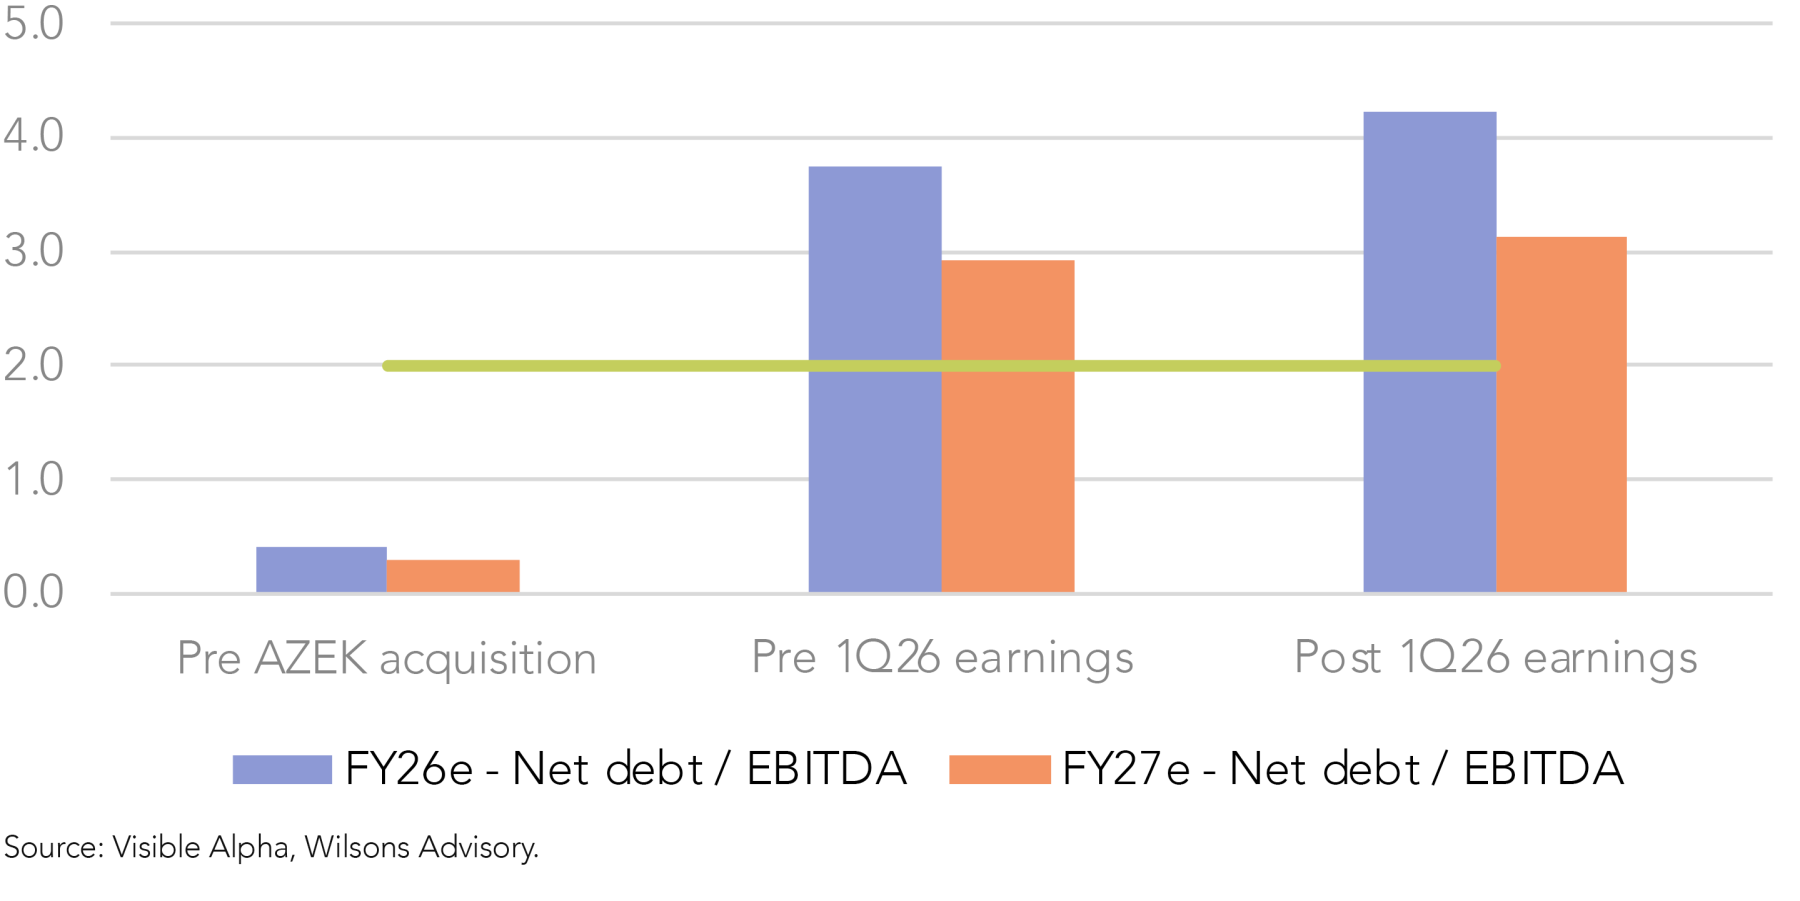
JHX’s balance sheet leverage has ballooned over the last 12 months. While JHX had already flagged that the AZEK acquisition would ‘temporarily’ increase its leverage, we had not anticipated an earnings downgrade of this magnitude, which has stretched its forward net debt/EBITDA ratio even further.
JHX’s FY26e net debt/EBITDA now sits above 4x, which is well above its target of 2x and key peers (0.5-2x). This is uncomfortably high for a cyclical business in a rapidly deteriorating market backdrop (and exposed to significant earnings risks). Therefore, the risk of a highly dilutive equity raise has increased materially since JHX’s 1Q26 update.
Uncompelling risk/reward despite share price decline
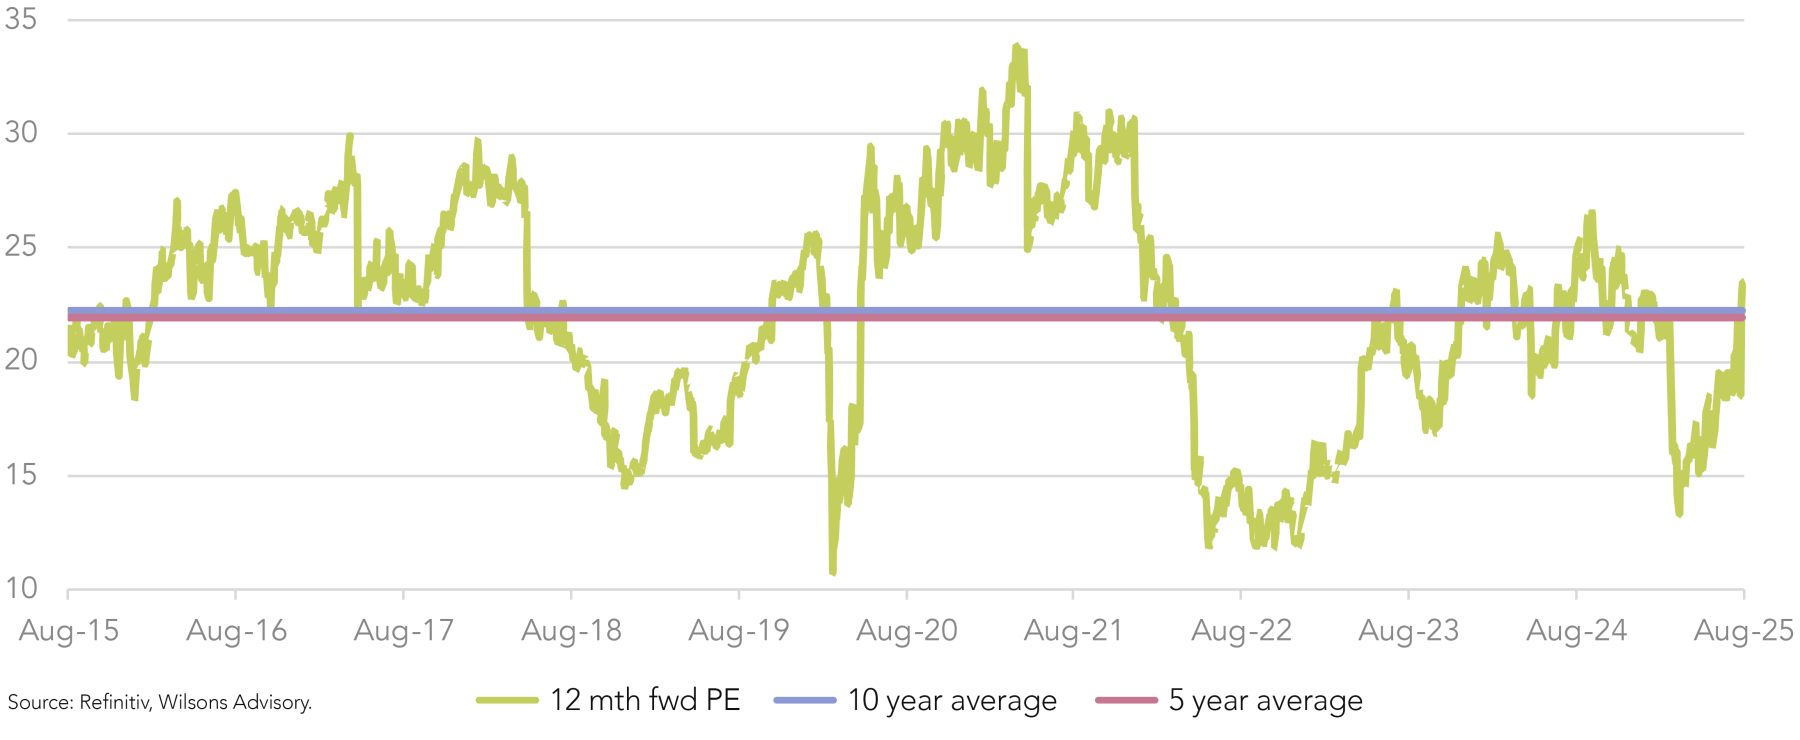
Given the severity of JHX’s consensus EPS downgrades has been greater than its share price decline this month, its forward PE is far from ‘cheap’ and has actually expanded since the result. JHX trades on a forward PE of ~24x, which is modestly above its five and ten year historical averages.
This is uncompelling considering the deteriorating market backdrop, the risk of a capital raise, questionable stewardship from management, and a consensus EPS CAGR of just ~5% (with risks more skewed to the downside than upside, in our view).
| Ticker | Company Name | Release date | Period | ISG view | Result summary |
| MQG | Macquarie Group | 24-Jul | 1Q26 | Negative | Macquarie’s 1Q26 update was qualitatively soft, with net profit contribution down versus the pcp (we estimate approximately -10%), driven by weakness in MAM and CGM. Following the update, we remain cautious around near-term consensus risks, with the street forecasting NPAT growth of +20% in 1H26 despite NPAT declining YoY in Q1, meaning MQG will need to deliver a very strong Q2 to meet consensus. While we are attracted to MQG’s exposure to long-term secular thematics (i.e. decarbonisation), we are looking for improved momentum in asset sales across MAM and MacCap (particularly in green assets) to gain greater conviction over the near/medium-term. |
| RMD | ResMed | 1-Aug | FY25 | Positive | ResMed’s FY25 result was solid, in line with our expectations. Sleep revenue growth lifted from 9% in Q3 to 10% in Q4, while gross margins were the highlight as they expanded 230bps YoY to 61.4% in Q4, well ahead of consensus forecasts of 60.0%. This underpinned EBIT growth of +19% (to US$454m), which was 5% above consensus, and EPS growth of +23% (to US$2.55), which was 2% ahead of consensus. Following 2–5% upgrades to consensus EPS over FY26–28, ResMed is expected to deliver 15% EPS growth in FY26 (vs 12% pre-result) and an 11% EPS CAGR over the next three years – with further upgrade potential remaining, particularly on gross margins. |
| PNI | Pinnacle Investment Management | 5-Aug | FY25 | Positive | Pinnacle posted a positive FY25 result, with NPAT +49% to $117m meeting our expectations, underpinned by strong inflows (Q4 $10.2bn) and FUM growth (+63% YoY) across the stable of affiliates. Life Cycle was by far the standout affiliate, where FUM grew to $15.4bn in just 9 months, effectively doubling consensus expectations of $7.8bn. Looking forward, Pinnacle is set up for another stellar year in FY26 given the healthy outlook for inflows (supported by Life Cycle and Metrics) and a positive performance fee outlook. Five V’s maiden performance fee contribution is due by December and several affiliates (Hyperion, Plato, Firetrail) at or near their high watermarks. |
| CAR | CAR Group | 11-Aug | FY25 | Positive | CAR delivered a credible FY25 result, with revenue of $1,144m (+12% YoY), which underpinned EBITDA of $641m (+12% YoY), in line with consensus. Management also guided to FY26 NPAT growth of 9-10% and EBITDA growth of 10-13%, slightly below consensus at the mid-point. Double-digit revenue growth is expected across all international markets, while high single-digit growth is expected in Australia. Despite cyclical pressures in the US RV market, Trader Interactive delivered A$308 million in revenue (+11% YoY) and A$186 million in EBITDA (+12% YoY), both modestly ahead of consensus, while management encouragingly pointed to ‘early signs of improvement’ in the US, suggesting cyclical headwinds may be easing. |
| EVN | Evolution Mining | 13-Aug | FY25 | Neutral | Evolution Mining (EVN) delivered a strong FY25 result, with underlying NPAT growing +99% YoY to $958m (+4% vs consensus) and EPS increasing +111% YoY to 46cps (+2% vs consensus). A record final dividend of 13cps was announced, which was triple the final dividend in FY24, while gearing fell from 25% to 15%. FY26 guidance assumes flat group volumes, ~20% lower CAPEX, and moderately higher unit costs. Combined with favourable gold pricing, these factors should support further free cash flow growth and de-leveraging over the medium-term. EVN continues to offer good value at a FY26 FCF yield of ~7% (with room for upgrades given consensus gold prices remain conservative). |
| WBC | Westpac | 14-Aug | 3Q25 | Positive | Westpac’s 3Q25 update was stronger than expected, with profits tracking well ahead of 2H25 consensus. Pre-provision profit rose +6% to $2.8bn, NPAT +14% to $1.9bn, and core NIM improved +5bps to 1.85%. Costs grew +3% (run-rating slightly below consensus), driven by Project UNITE, but pleasingly positive jaws were maintained as revenue rose +4%. Credit quality held up with impairment charges remaining low at 5bps, while CET1 lifted to 12.3%. With 3Q25 NPAT of $1.9bn, WBC only needs to deliver ~$1.4bn in the Q4 to achieve consensus. Accordingly, the quarterly update has resulted in mid single digit EPS upgrades from consensus. |
| ANZ | ANZ | 15-Aug | 3Q25 | Neutral | ANZ’s 3Q25 trading update was light on detail but positive overall, with CET1 up +16bps to 11.94% (ahead of consensus), loan growth of +$16bn (tracking ahead of 2H targets), and impairment charges were just $97m (well below consensus). Nonperforming loans also edged lower to 0.77%, reflecting resilient credit quality. While the update lacked full earnings disclosure, the key trends suggest FY25e consensus remains well supported. |
| HCW | HealthCo REIT | 15-Aug | FY25 | Neutral | HealthCo REIT (HCW) reported FY25 FFO of 6.6cps (-18% YoY), which was in line with guidance after adjusting for suspended UHF distributions. NTA fell -9% HoH to $1.44/unit broadly in line with our estimates after HCW's June revaluations. Dividends are currently suspended to preserve capital amid Healthscope’s receivership. The balance sheet remains solid, with 31% gearing and $104m liquidity. Looking forward, the key catalyst for HCW will be the resolution of the Healthscope situation, which we expect over the next 3-6 months, although a high degree of uncertainty remains. HCW continues to trade at a significant discount to NTA. |
| BHP | BHP | 19-Aug | FY25 | Neutral | BHP finished FY25 strongly, supported by robust free cash flow, favourable working capital, and lower CAPEX, which underpinned a higher-than-expected 60% dividend payout. Iron ore contributed over half of group EBITDA at a 63% margin, while copper also improved, accounting for 45% at a 59% margin. Medium-term CAPEX has been reduced by US$1bn as project schedules are adjusted. WAIO delivered record production with industry-leading costs, and the approval of car dumper #6 will underpin an expansion of shipment capacity. |
| CSL | CSL | 19-Aug | FY25 | Negative | CSL’s FY25 result was a very low quality NPATA beat (driven by lower R&D and tax expenses), while its guidance was weak. FY26 guidance is for NPATA growth of 7-10%, which at the mid-point is below consensus (+9%), despite excluding US$700-770m of restructuring costs and including some initial cost-out benefits. Since the result, FY26e consensus EPS (NPATA) has been downgraded by 4%.The most disappointing element was the -8% EBITDA miss by Behring – long regarded as CSL’s growth engine – driven by weakness in IG sales. Management's decision to abandon its timeline for Behring’s gross margin recovery, which has been central to CSL’s medium-term EPS growth outlook, has undermined our investment thesis. |
| HUB | HUB24 | 19-Aug | FY25 | Neutral | HUB24 (HUB) reported 1H25 operating revenue growth of +28% to $323.3m and EBITDA growth of +38% to $162.4m, both slightly short of expectations. Platform margins were marginally ahead, while EPSA of 117.8cps beat consensus by 5% on a lower effective tax rate. Free cash flow was stellar at $121.1m, aided by lower tax payments and a working capital benefit. FUA rose to $118b, a $5.3b increase since the end of FY25, with about half from net inflows – an encouraging start to FY26. Looking ahead, HUB has guided to OPEX growth in the mid-teens and modest revenue margin compression, reflecting necessary reinvestment to allow HUB to deliver further Platform EBITDA margin expansion, which supports >30% EPS growth in FY26. |
| TLC | The Lottery Corp | 20-Aug | FY25 | Positive | The Lottery Corporation (TLC) delivered a solid FY25 result, modestly beating consensus across the board. Earnings declined as expected as the business cycled a record jackpot year, while margin pressure from operating deleverage was partly offset by impressive digital penetration, which rose to 41.8% (vs consensus of 40.7%). TLC’s strong balance sheet supports a 100% payout ratio and positions the company well for the Victorian licence renewal in 2028. Looking ahead, TLC is positioned for a return to double-digit EPS growth in FY26, supported by a +16.7% Powerball price rise (expected in November) and a likely rebound in lottery activity after a soft year. |
| JHX | *James Hardie | 20-Aug | 1Q26 | Negative | Removed from portfolio post result. JHX’s 1Q26 update was significantly worse than expected. In Q1, EPS fell -59% to 15cps, well below prior consensus forecasts of 36cps, which were looking for flat EPS compared to Q1 FY25. Management also updated its guidance, and now expects EBITDA of US$1.05-1.15bn in FY26, which is ~15-20% below consensus (on a like-for-like basis). Previously, JHX guided towards flat-to-low single digit growth in North American volumes; however, the latest guide implies low double digit declines for the legacy sidings business (ex AZEK) – a substantial lowering of expectations in just a three month period. The weaker guidance has translated to dramatically lower consensus EPS, with estimates now implying a -40% YoY EPS decline in FY26, compared to previous expectations of +33% YoY growth, and we see further downside risks to earnings amidst the rapidly deteriorating market backdrop. |
| TLX | Telix Pharmaceuticals | 20-Aug | 1H25 | Negative | Telix (TLX) reported US$390M in 1H25 revenue, up 63% YoY, with ILLUCCIX contributing US$305M (+30% YoY). Group EBIT fell materially to US$10.4m, making 1H25 an effectively 'break even' half. TLX flagged prior to the result that 1H25 OPEX would be materially higher than prior sellside/buyside expectations due to its investments in its infrastructure, market development, and R&D. While higher near-term OPEX have driven near/medium-term EPS downgrades, taking a longer term view these investments are appropriate and necessary and will enable TLX to self-fund its pipeline commiseration. Ultimately, TLX plans to reinvest its ILLUCCIX cash flows into its pipeline to drive long-term growth. Looking forward, we expect revenue growth in Precision Medicine and pipeline progress to be the key drivers of the stock for the foreseeable future, rather than near-term EPS. Key upcoming catalysts include the imminent ZIRCAIX approval and GOZELLIX’s TPT status confirmation which is expected next month. |
| SGP | *Stockland | 20-Aug | FY25 | Positive | Added to portfolio post result. SGP posted a solid FY25 result, with FFO of 33.9cps (+2.7% YoY), which was slightly ahead of consensus of 33.3cps. The highlight of the result was SGP’s master-planned communities (MPC) settlements, which grew +22% YoY to 6.87k, comfortably above guidance of 6.2k-6.7k lots. Guidance for FFO of 36-37cps in FY26 implies 6-9% growth YoY, and management flagged it expects MPC settlements of 7.5-8.5k, which at the mid-point is 3% above consensus. Overall, this result has demonstrated strong execution from SGP's MPC business, with positive momentum into FY26 highlighting that a residential recovery is well underway. |
| GMG | Goodman Group | 21-Aug | FY25 | Neutral | Goodman Group's (GMG) FY25 result was in line with consensus, with operating earnings +13% to $2,311m and DPS unchanged at 30cps. FY26 guidance is slightly soft at +9% EPS growth vs consensus of 11%, consistent with GMG’s history of initially conservative guidance that is typically upgraded over the year. Data centres now account for 57% of WIP, which includes recent project starts in Los Angeles and Paris, while GMG has retained its target of 0.5GW of data centre commencements by June 2026. Yield on commencements rose to 9.2%, reflecting the higher-margin nature of data centre projects. Overall, GMG has shown positive progress on its data centre strategy, which keeps us positive towards the business. |
| BXB | Brambles | 21-Aug | FY25 | Positive | Brambles (BXB) delivered a strong FY25 result and outlook, with its FCF generation being the highlight. Revenue grew +3% as softer volumes were offset by pricing and new business wins, EPS grew +14% to 62.5cps (slightly above consensus of 61.1cps), and FCF increased +24% to US$1,095m (16% above consensus), driven by its asset efficiency initiatives which have reduced pallet loss expenses, as well as a material drop in new pallet costs (-6% YoY). IPEP expenses (pallet loss provisions) of US$94m were also lower than expected, reflecting the success of efficiency programs in driving greater profitability. BXB has provided FY26 guidance for FCF of US$850-950m, which is comfortably above consensus of US$807m, and the business also announced a $400m on-market buyback which should further support shareholder returns. |
| NST | Northern Star | 21-Aug | FY25 | Neutral | Northern Star (NST) released a well-flagged FY25 result, with gold sales and AISC within guidance and cash earnings above consensus. FY26 guidance, however, surprised negatively in an earlier operational update, with higher AISC and CAPEX rebasing market expectations lower. Operational delivery will be key near-term to restore investor confidence in the business. Nevertheless, NST’s medium-term outlook remains attractive, supported by strong production growth from the KCGM mill expansion (FY27) and Hemi development (FY28), and the unwinding of its hedge book, which together will underpin an attractive free cash flow build over time. |
| STO | Santos | 25-Aug | 1H25 | Neutral | Santos (STO) delivered a sound 1H25 result, broadly in line with expectations, with FCF from operations of US$1,552m (vs US$1,495m expected) and EBITDAX of US$1,758m (in line with consensus). FY25 guidance was re‑iterated, with production of 90–95 mmboe and capex US$2.4–2.6bn. Positively, first oil at Pikka has been accelerated to 1Q26, ahead of prior mid-2026 guidance, and first gas at Barossa is imminent, which combined are set to drive a ~30% production increase by 2027. Separately, STO has announced that the due diligence process for the potential takeover has been extended to 19 September 2025, with the XRG Consortium confirming no issues have emerged. |
* SGP is a recent addition to the Focus Portfolio, JHX is a recent removal. Source: Refinitiv, Visible Alpha, Wilsons Advisory.

Written by
Greg Burke, Equity Strategist
Greg is an Equity Strategist in the Investment Strategy team at Wilsons Advisory. He is the lead portfolio manager of the Wilsons Advisory Australian Equity Focus Portfolio and is responsible for the ongoing management of the Global Equity Opportunities List.
About Wilsons Advisory: Wilsons Advisory is a financial advisory firm focused on delivering strategic and investment advice for people with ambition – whether they be a private investor, corporate, fund manager or global institution. Its client-first, whole of firm approach allows Wilsons Advisory to partner with clients for the long-term and provide the wide range of financial and advisory services they may require throughout their financial future. Wilsons Advisory is staff-owned and has offices across Australia.
Disclaimer: This communication has been prepared by Wilsons Advisory and Stockbroking Limited (ACN 010 529 665; AFSL 238375) and/or Wilsons Corporate Finance Limited (ACN 057 547 323; AFSL 238383) (collectively “Wilsons Advisory”). It is being supplied to you solely for your information and no action should be taken on the basis of or in reliance on this communication. To the extent that any information prepared by Wilsons Advisory contains a financial product advice, it is general advice only and has been prepared by Wilsons Advisory without reference to your objectives, financial situation or needs. You should consider the appropriateness of the advice in light of your own objectives, financial situation and needs before following or relying on the advice. You should also obtain a copy of, and consider, any relevant disclosure document before making any decision to acquire or dispose of a financial product. Wilsons Advisory's Financial Services Guide is available at wilsonsadvisory.com.au/disclosures.
All investments carry risk. Different investment strategies can carry different levels of risk, depending on the assets that make up that strategy. The value of investments and the level of returns will vary. Future returns may differ from past returns and past performance is not a reliable guide to future performance. On that basis, any advice should not be relied on to make any investment decisions without first consulting with your financial adviser. If you do not currently have an adviser, please contact us and we would be happy to connect you with a Wilsons Advisory representative.
To the extent that any specific documents or products are referred to, please also ensure that you obtain the relevant disclosure documents such as Product Disclosure Statement(s), Prospectus(es) and Investment Program(s) before considering any related investments.
Wilsons Advisory and their associates may have received and may continue to receive fees from any company or companies referred to in this communication (the “Companies”) in relation to corporate advisory, underwriting or other professional investment services. Please see relevant Wilsons Advisory disclosures at www.wilsonsadvisory.com.au/disclosures.
