
Australian Real Estate Investment Trusts (A-REITs) have generally underperformed the broader market since the RBA shifted to a tightening bias in 2022, albeit with some exceptions – most notably index heavyweight Goodman Group.
However, the macro backdrop has become increasingly supportive of the A-REIT sector, with the RBA likely to cut interest rates multiple times this year – a shift that should support property valuations as well as growth in rental income and earnings over the medium-term. Historically, interest rate-cutting cycles have generally coincided with A-REIT sector outperformance.
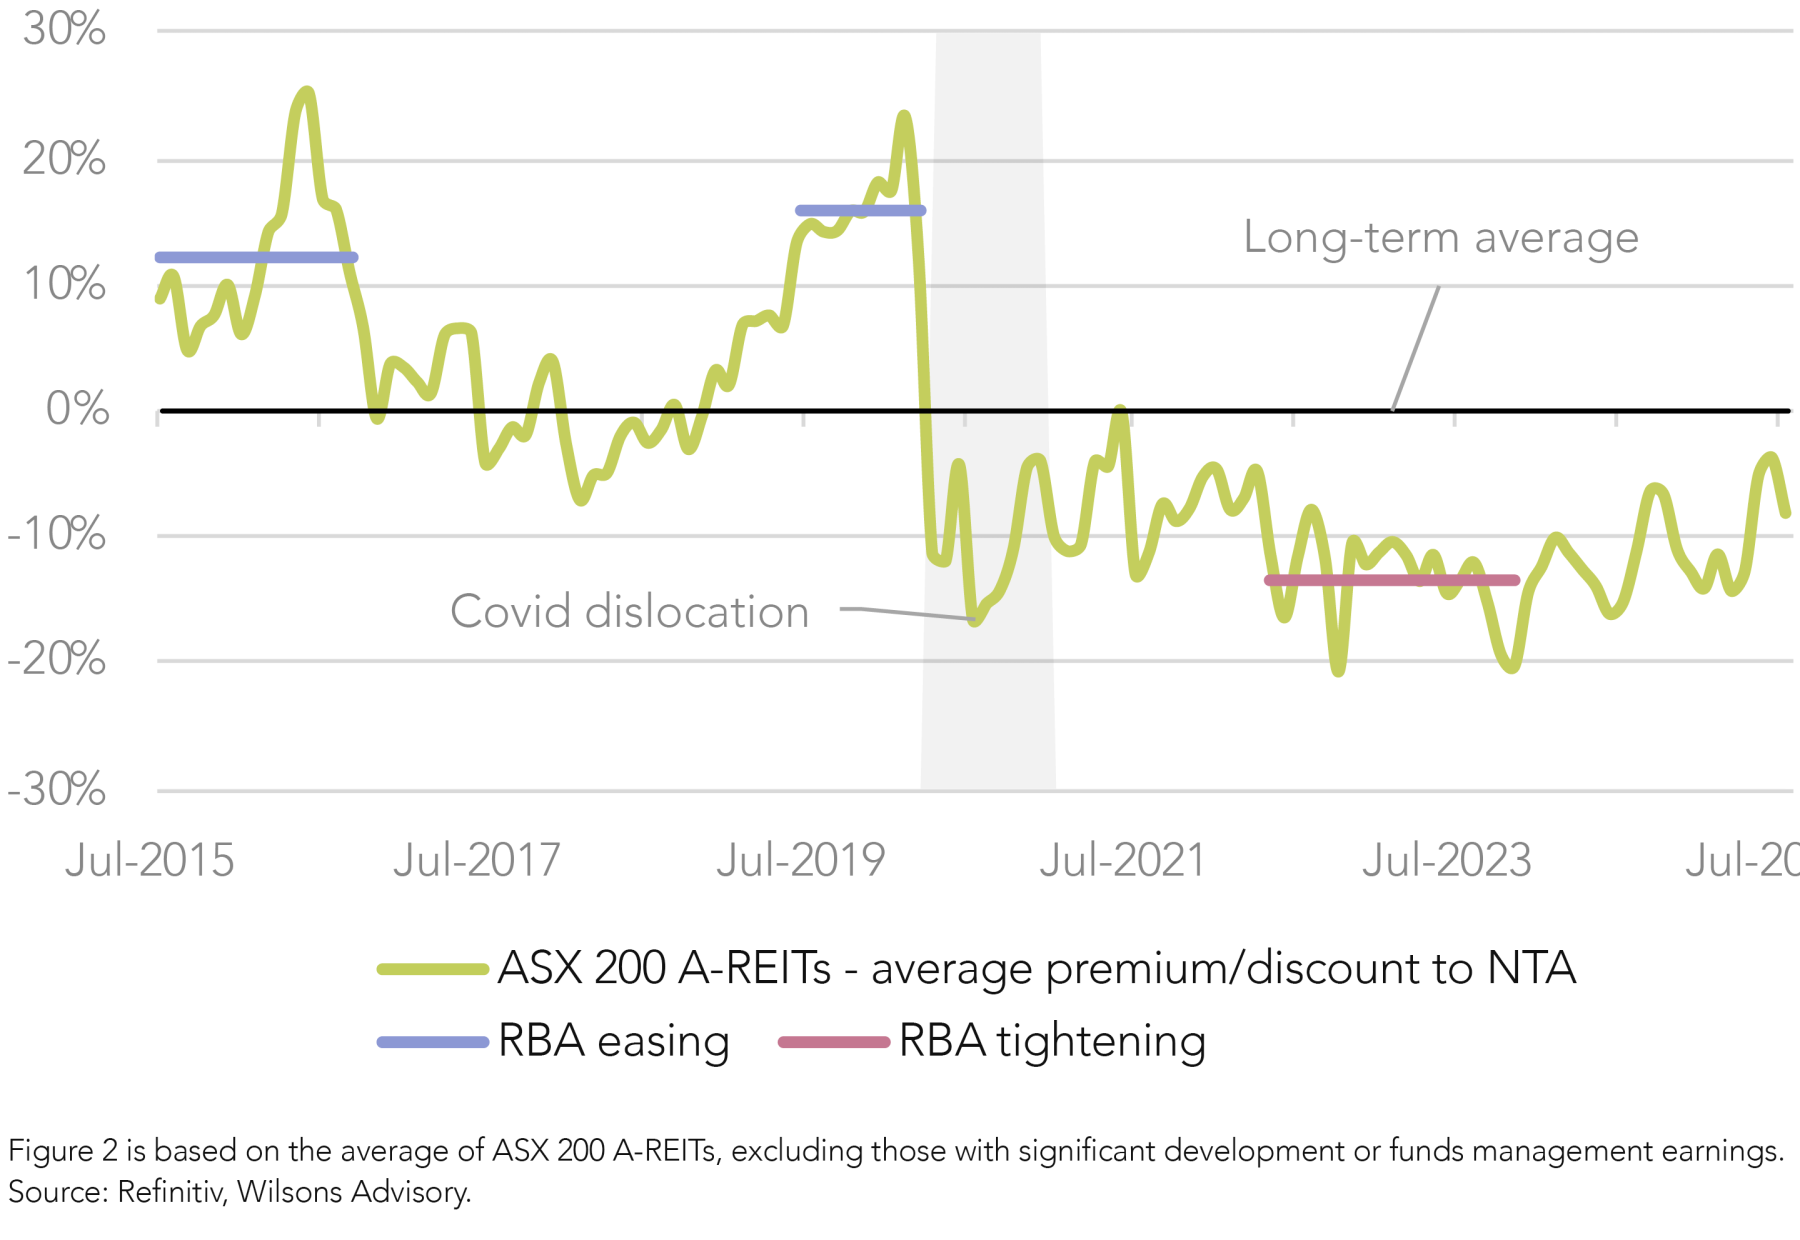
From a valuation standpoint, the majority of ASX 200 A-REITs trade on discounts to their net tangible asset (NTA) values, which presents capital growth opportunities in addition to highly attractive distribution yields. Moreover, there is early evidence that property values have already troughed, suggesting we are at a turning point in the cycle.
In this report, we examine how the A-REIT sector has historically performed during interest rate cutting cycles and share our views across the major sub-sectors. Specifically, we highlight signs of stabilisation in office markets, ongoing strength in industrial assets and data centres, improving fundamentals in the residential and retail sectors, and the deep value that has emerged in the out-of-favour private hospital space.
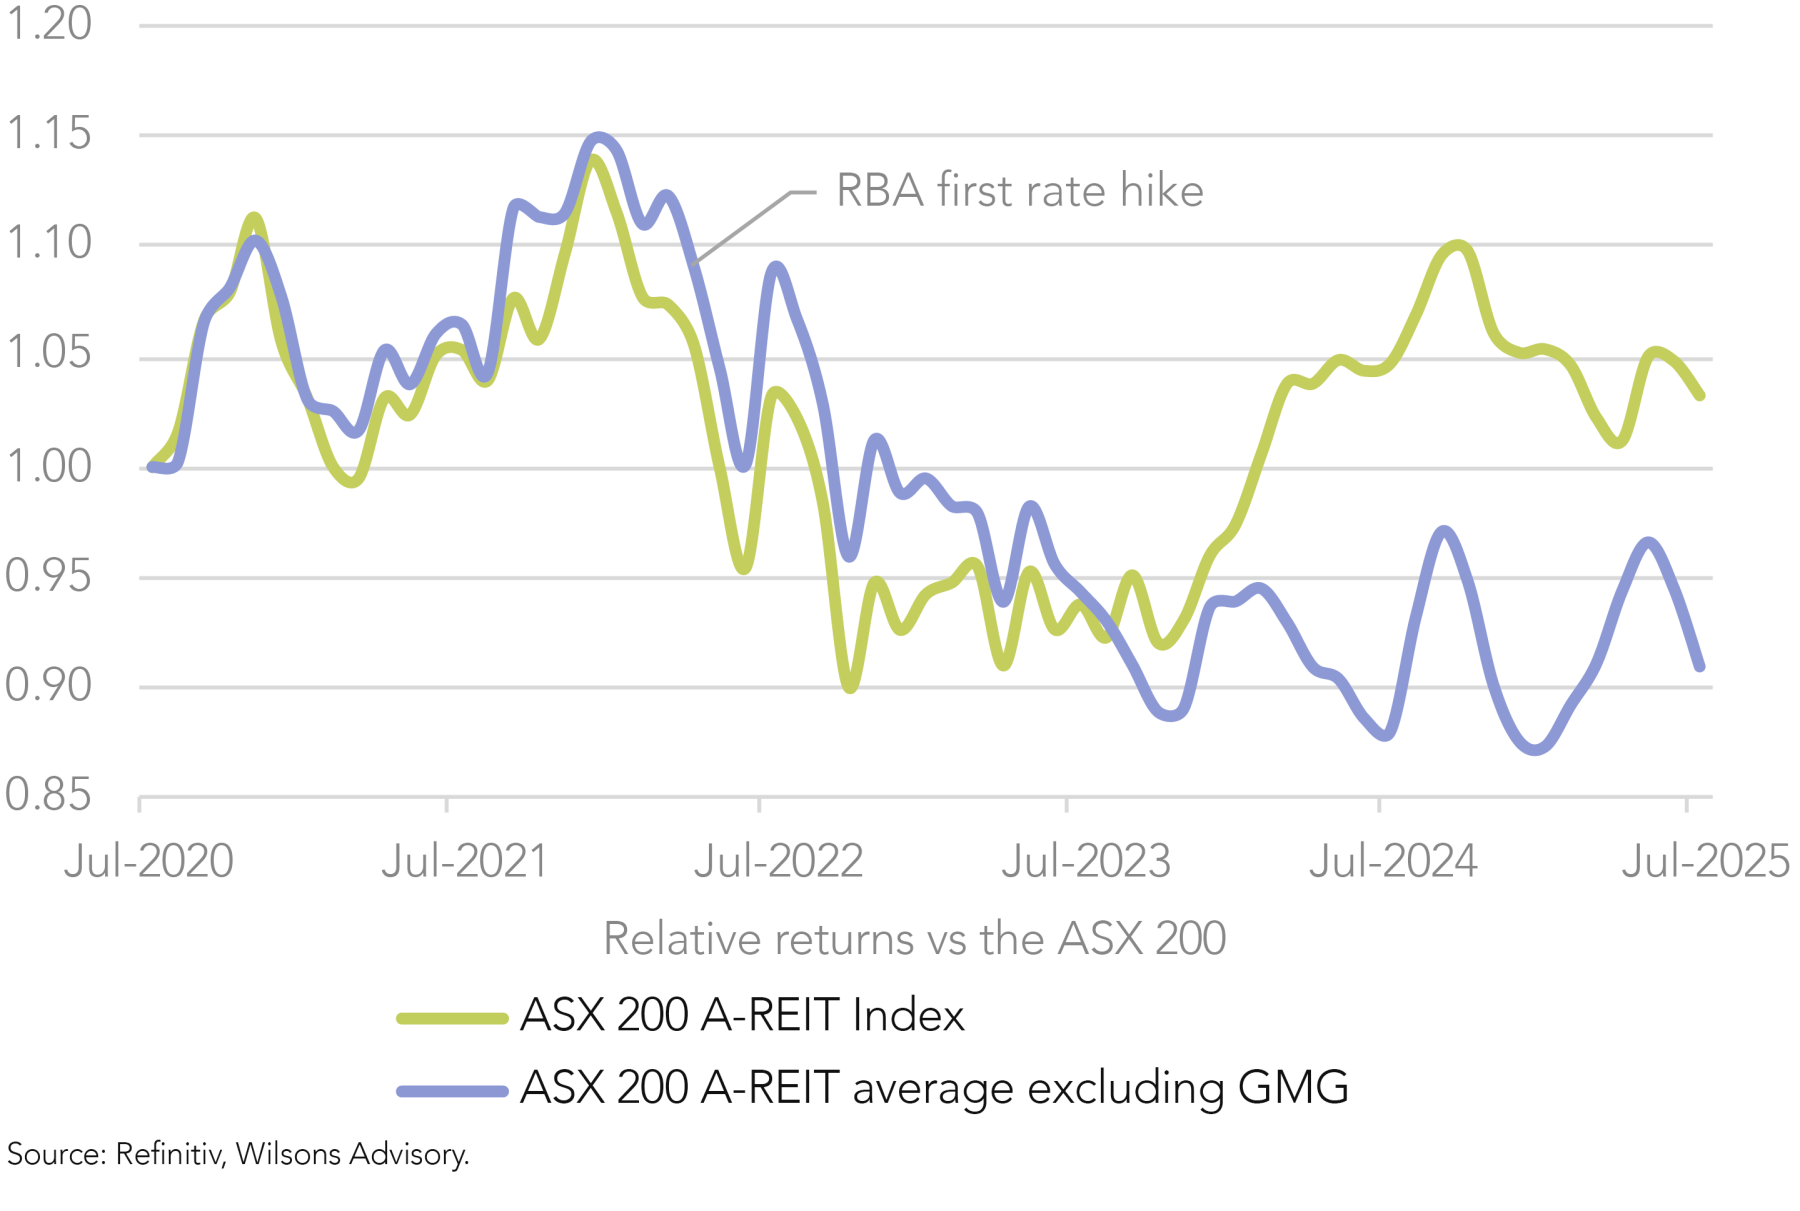
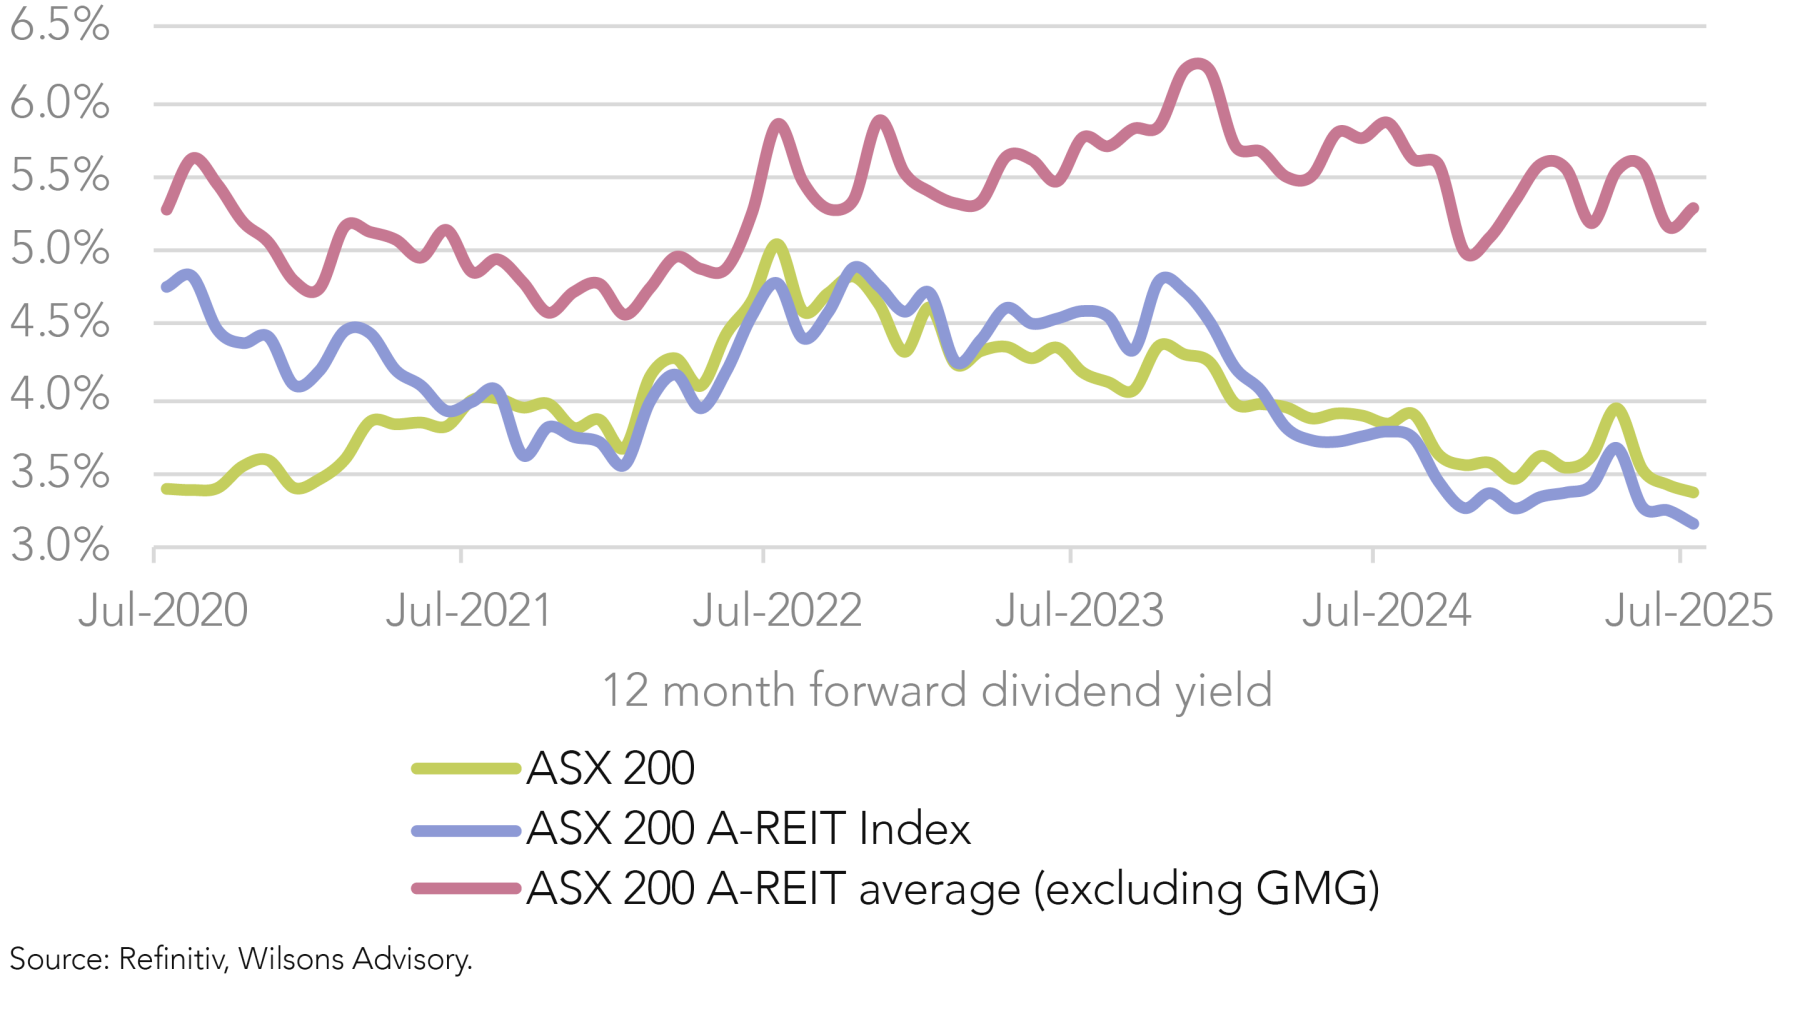
Rate Cuts are Typically a Tailwind for A-REITs
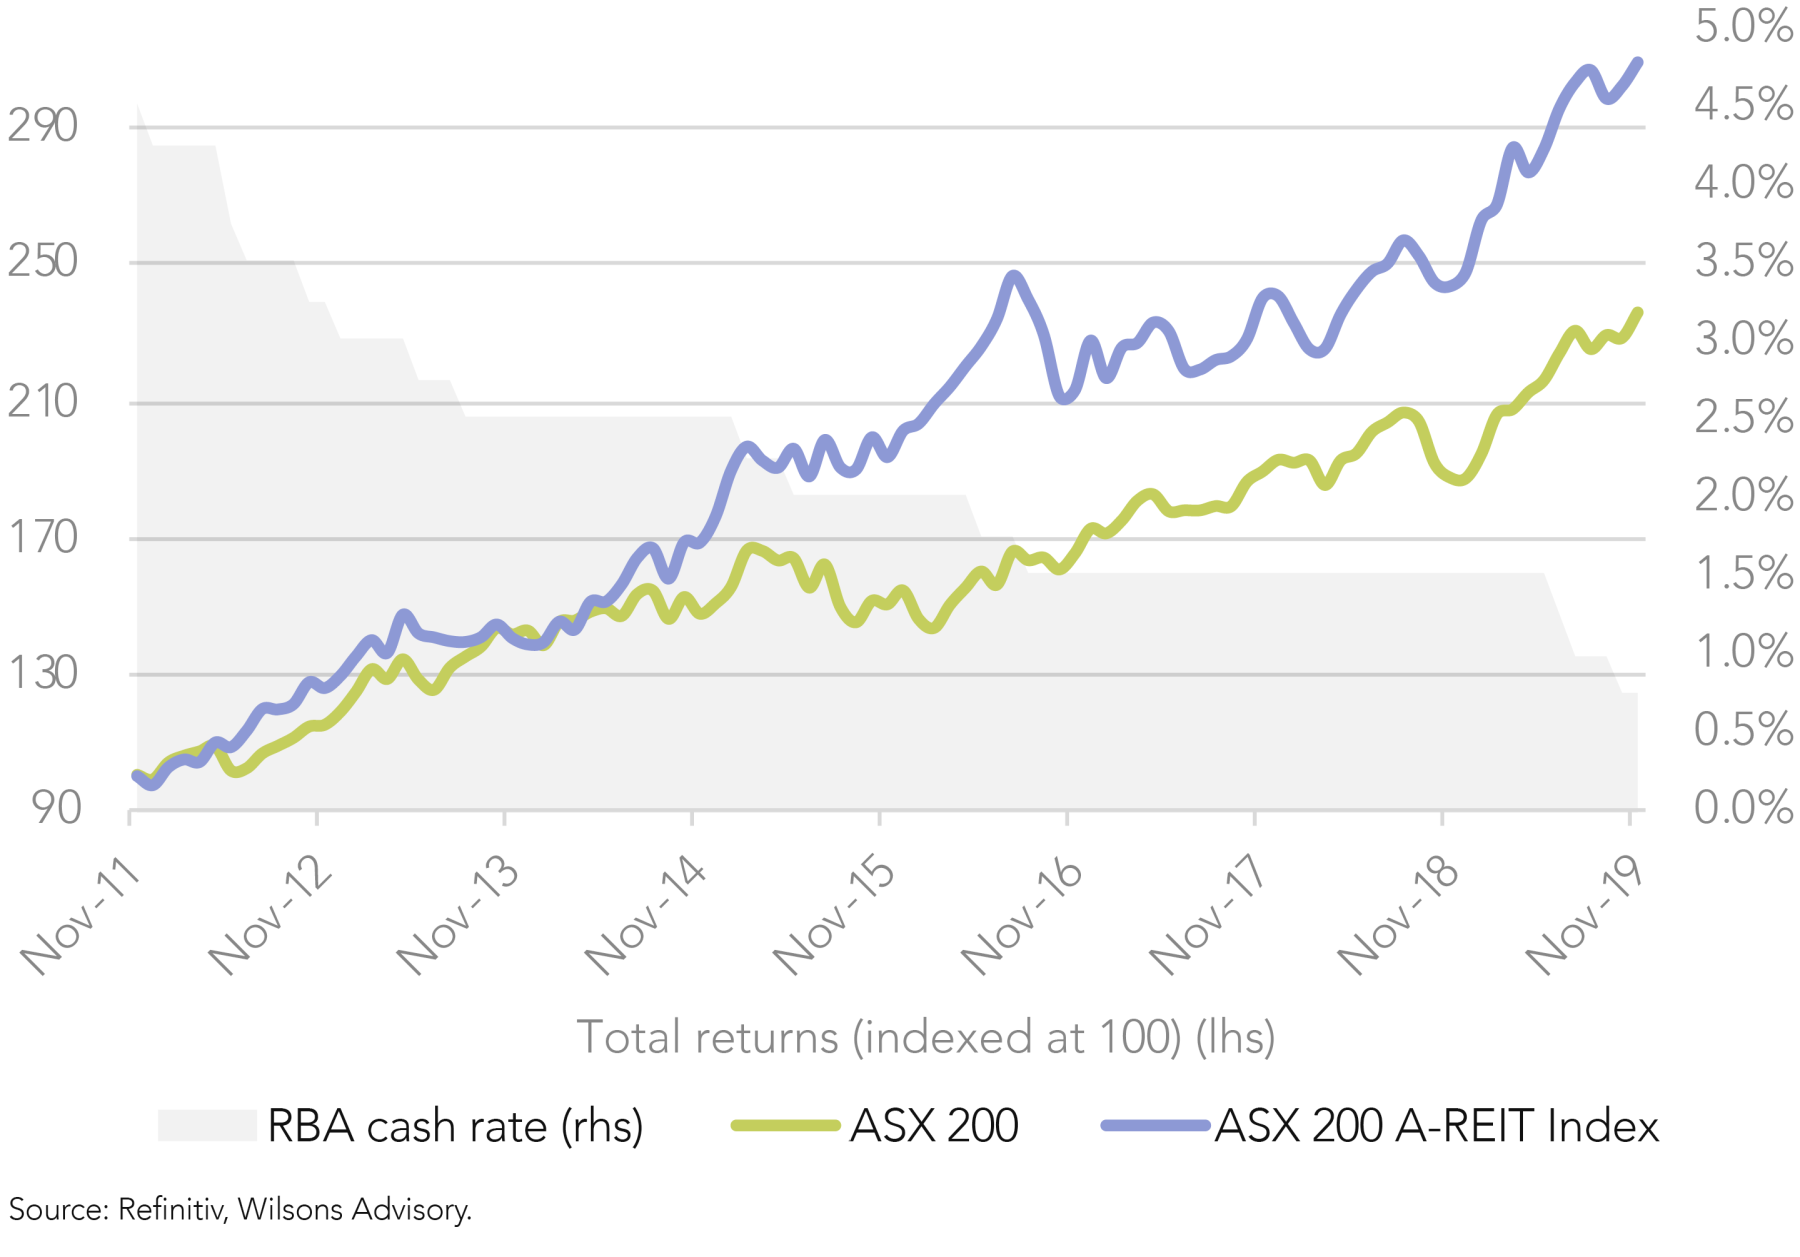
Historically, A-REITs have generally outperformed during interest rate cutting cycles, excluding abnormal periods such as the GFC (when asset write-downs and excessive gearing led to widespread emergency recapitalisations) and Covid-19 (which necessitated broad-based rental abatements due to lockdowns).
In periods of declining interest rates, A-REITs typically benefit from upward revisions to their NTA values as capitalisation rates compress, while price/NTA valuations also tend to re-rate higher. At the same time, earnings growth is usually supported by lower interest costs and improving tenant demand (albeit this can vary by sub-sector).
Between late 2011 and early 2020, when the RBA was either cutting the cash rate or maintaining an accommodative stance, the A-REIT sector meaningfully outperformed the broader market.
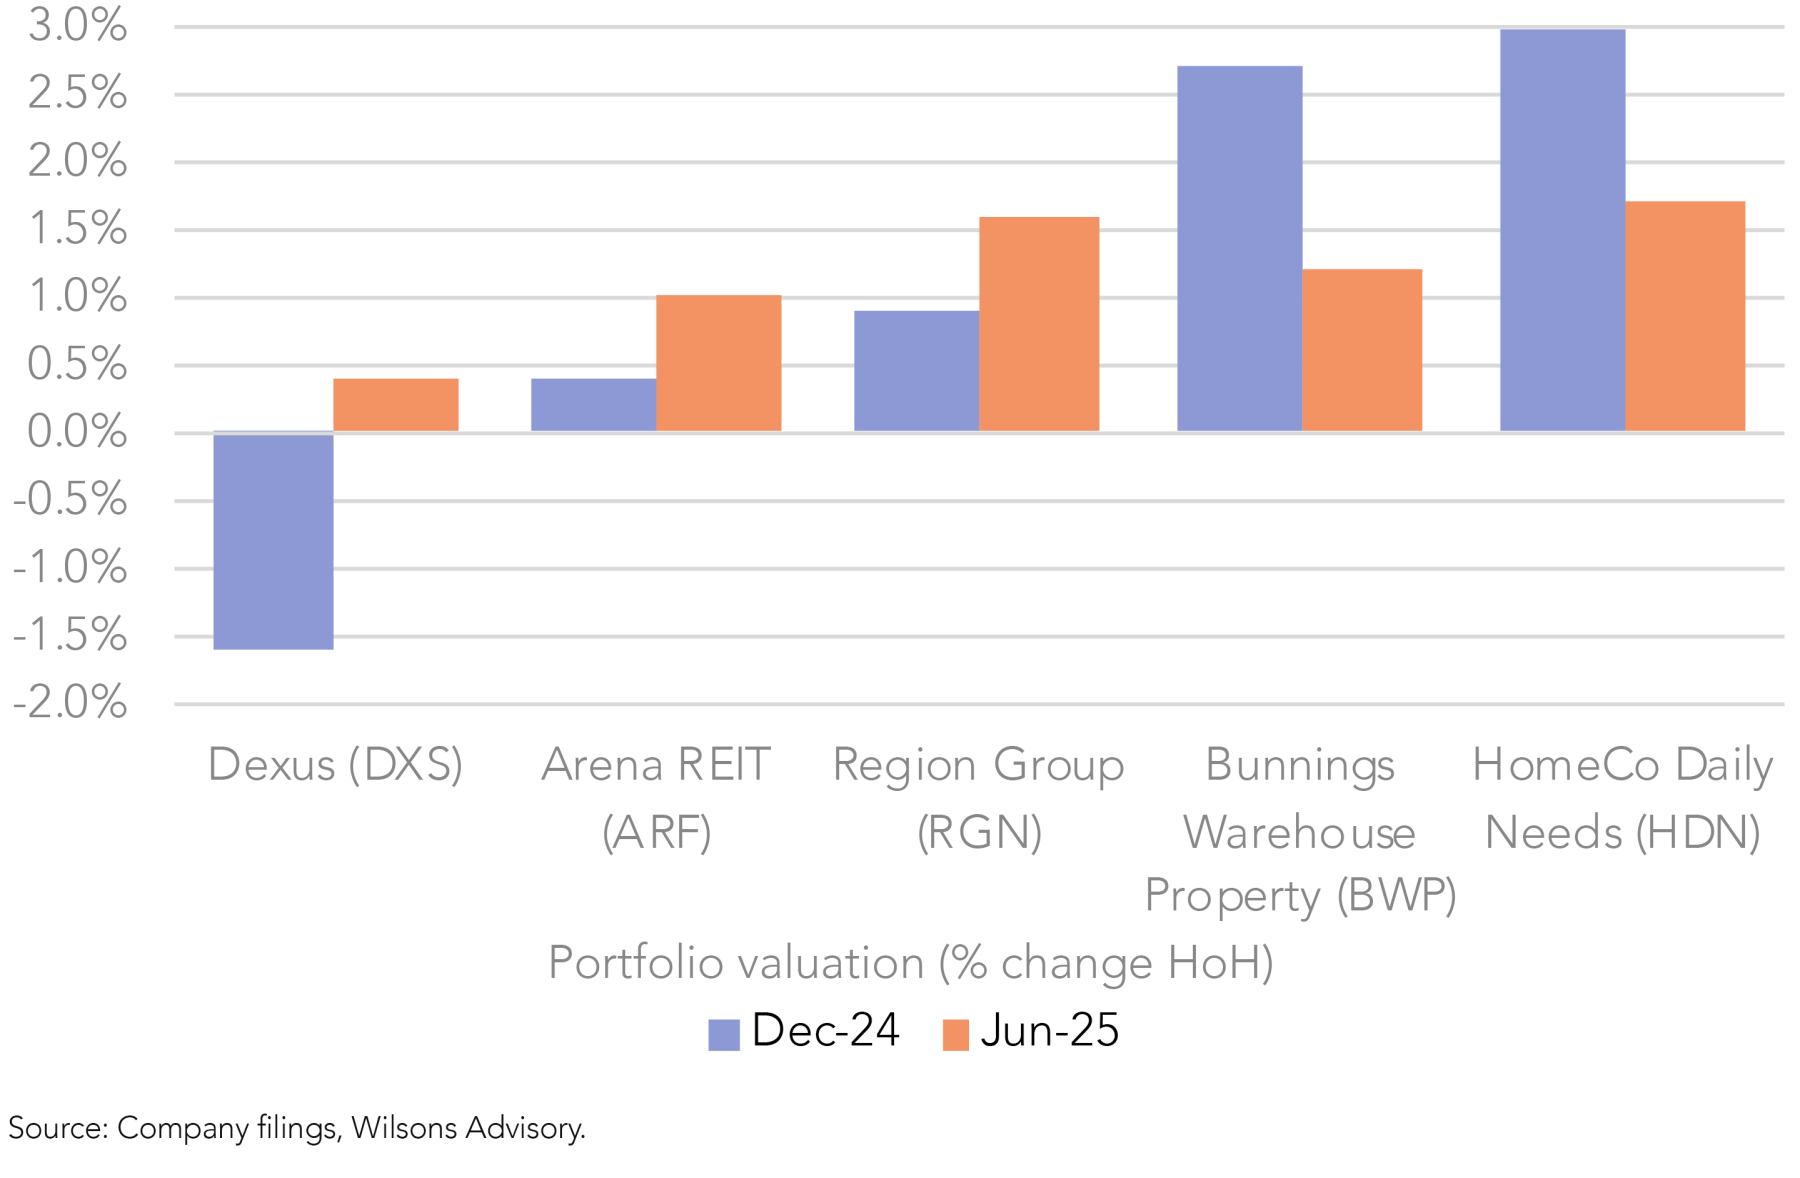
Currently, many A-REITs trade at material discounts to their NTA values (see Figure 6). In addition, after a three-year period of broadly declining asset values, recent indicative June 2025 portfolio valuation updates from the sector have pointed to a rebasing of property values, with early signs of positive revaluations beginning to emerge (see Figure 5).
Together, these factors present meaningful capital growth opportunities for A-REIT investors over the medium-term.
With valuations appearing broadly attractive and the interest rate environment turning supportive, the outlook for the A-REIT sector has become increasingly compelling.
| Name | Ticker | Key metrics | Key sub-sector exposures | |||||||||
| Price/AFFO | Premium / discount to NTA^ | Dividend yield | 3yr AFFO CAGR (CY25-28) | Office | Industrial | Retail | Residential | Data Centres | Specialised* | |||
| HealthCo REIT | HCW | 10.6 | -53% | 10.3% | 6.5% | x | Focus Portfolio holding | |||||
| Rural Funds Group | RFF | 15.2 | -40% | 6.5% | 5.3% | x | Wilsons Research O/W rated | |||||
| DigiCo Infrastructure REIT | DGT | 24.5 | -33% | 5.2% | 12.4% | x | ||||||
| Centuria Industrial REIT | CIP | 20.7 | -24% | 5.4% | 2.3% | x | ||||||
| Dexus | DXS | 15.3 | -22% | 5.4% | 3.6% | x | x | |||||
| HomeCo Daily Needs REIT | HDN | 16.2 | -21% | 7.0% | 4.1% | x | ||||||
| Charter Hall Retail REIT | CQR | 17.4 | -20% | 6.6% | 2.8% | x | x | |||||
| Waypoint REIT | WPR | 15.7 | -16% | 6.9% | 2.9% | x | x | |||||
| Mirvac | MGR | 21.6 | -15% | 4.6% | 11.2% | x | x | x | x | |||
| BWP Trust | BWP | 18.9 | -14% | 5.5% | 2.5% | x | ||||||
| Charter Hall Long WALE REIT | CLW | 18.1 | -14% | 6.1% | 1.7% | x | x | x | ||||
| Region Re | RGN | 17.3 | -13% | 6.2% | 3.5% | x | ||||||
| National Storage REIT | NSR | 20.7 | -12% | 5.0% | 4.2% | x | ||||||
| GPT Group | GPT | 19.1 | -12% | 4.9% | 5.9% | x | x | x | x | |||
| Scentre Group | SCG | 18.6 | -2% | 4.9% | 5.1% | x | ||||||
| Arena REIT | ARF | 20.3 | 1% | 5.3% | 4.0% | x | ||||||
| Vicinity Centres | VCX | 19.4 | 2% | 5.1% | 5.5% | x | ||||||
| Stockland | SGP | 17.6 | 23% | 5.1% | 8.0% | x | x | x | x | x | ||
| Ingenia Communities | INA | 17 | 29% | 2.8% | 13.9% | x | ||||||
| Goodman Group | GMG | 26.6 | >100% | 0.9% | 12.0% | x | x | Focus Portfolio holding | ||||
| Charter Hall | CHC | na | >100% | 2.6% | 10.0% | x | x | x | x | |||
| Centuria Capital | CNI | na | >100% | 6.3% | 8.7% | x | x | x | x | |||
All figures are based on 12 month forward consensus estimates unless otherwise stated. *Includes healthcare and social infrastructure, self-storage, hospitality, agriculture. *Specialised property includes healthcare and social infrastructure, self-storage, hospitality, agriculture. ^Refers to NAV for RFF. Source: Visible Alpha, Refinitiv, Wilsons Advisory.
Office – Green Shoots Emerging
Office market fundamentals remain subdued: national vacancy rates are elevated at 13.7%, the highest level since the 1990s; incentives continue to trend higher, weighing on net effective rental growth; and transaction activity remains below average amidst subdued buyer sentiment.
However, there are early signs that the sector is poised for recovery, led by well-located prime assets. On the demand side of the equation, interest rate cuts and improved business conditions should support greater office-based employment, while physical office attendance – currently at 76.6% – has continued to improve amidst a growing number of ‘return to office’ mandates.
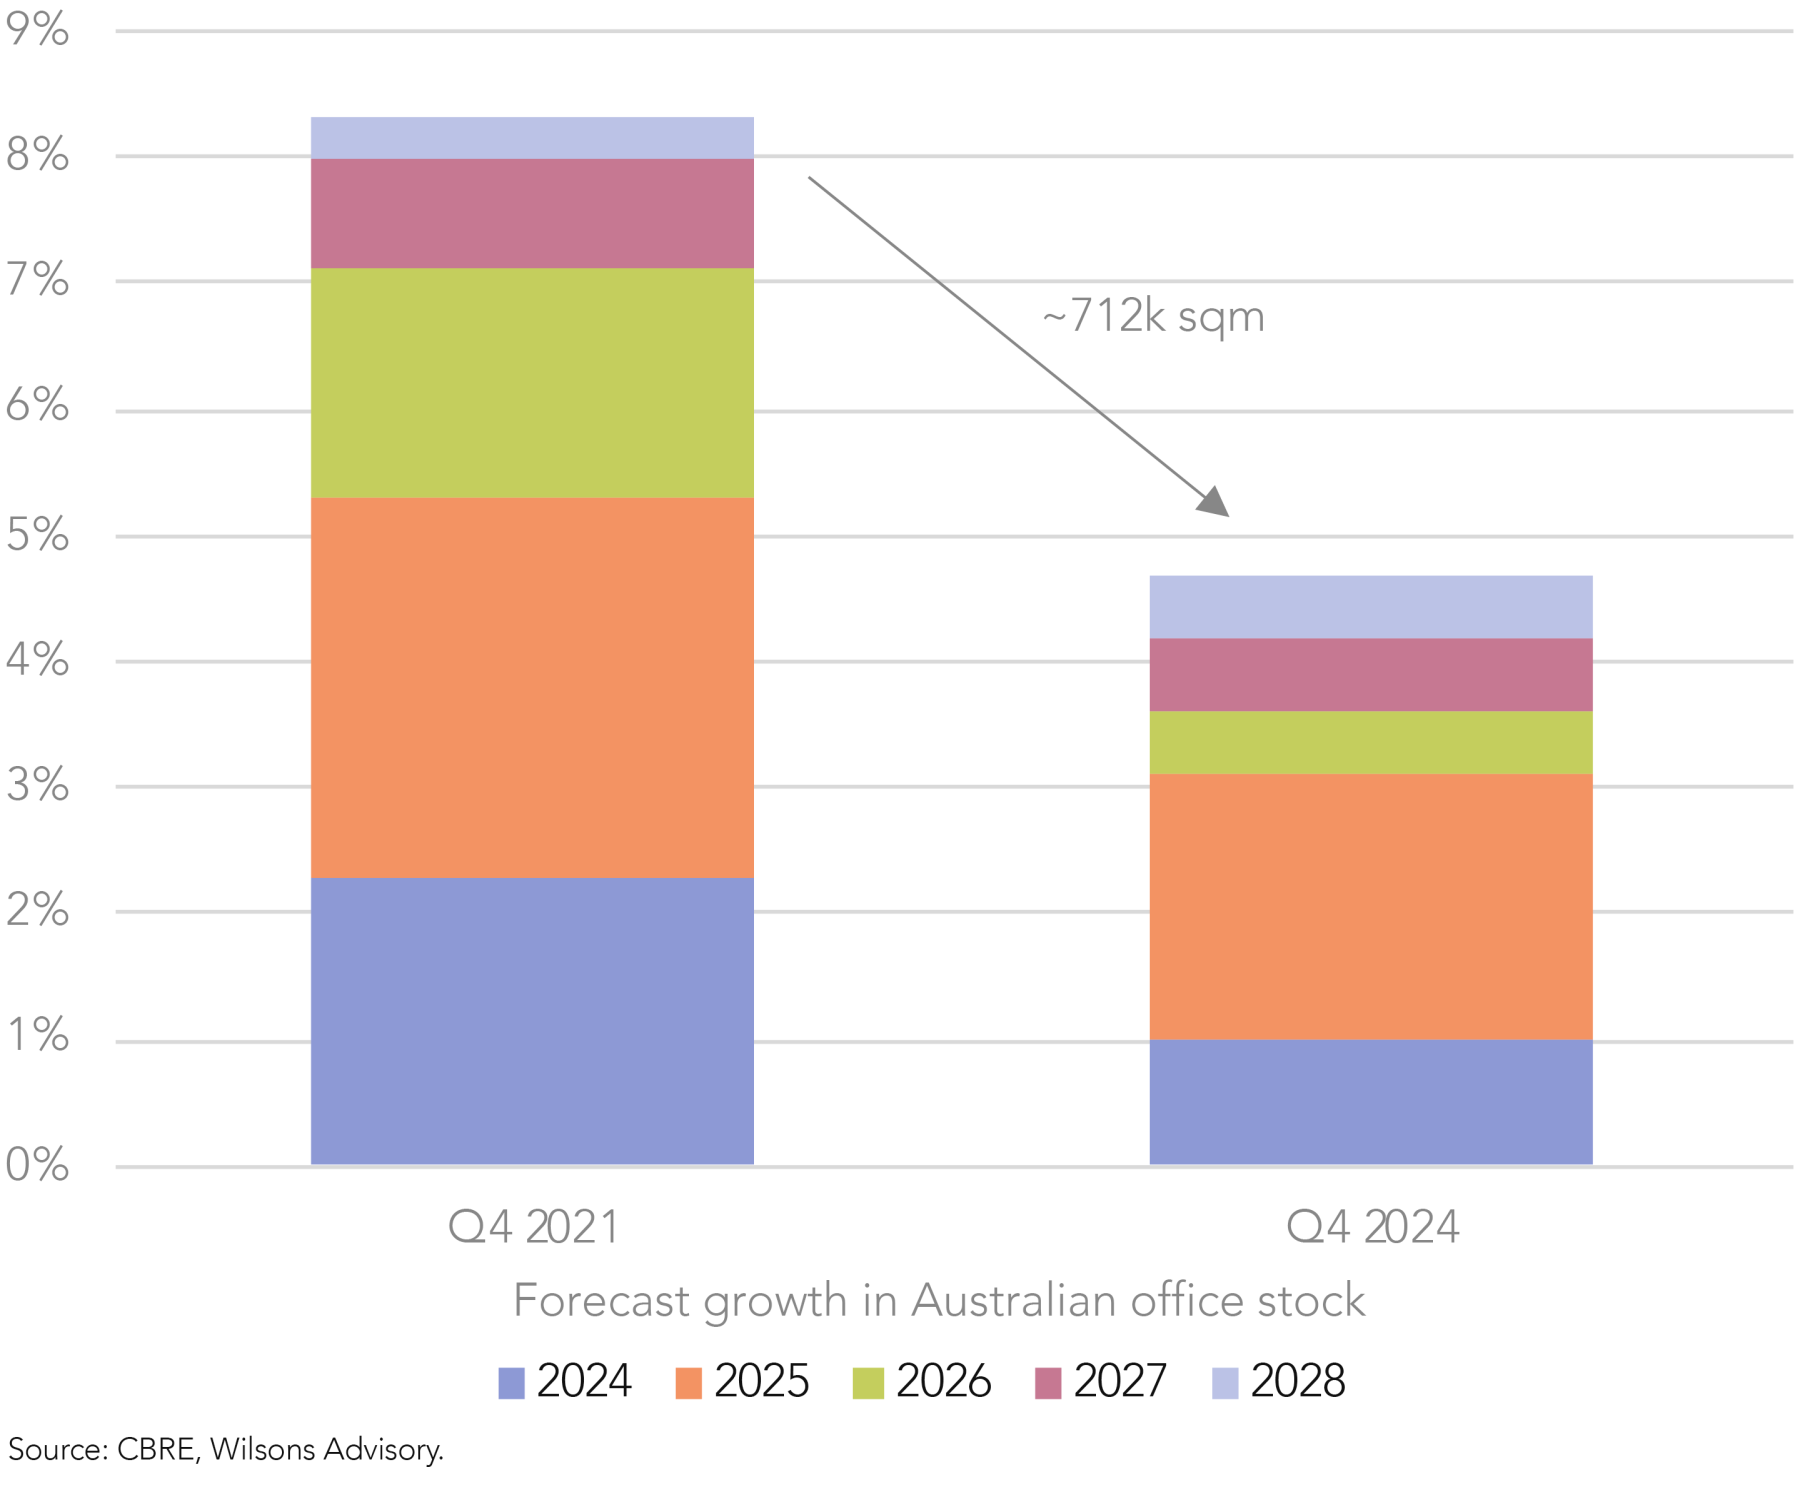
Moreover, new office supply growth is set to slow to its lowest level since 2018, driven by weak investor sentiment and high construction costs. With capital values now below replacement cost in many markets, development commencements are likely to remain constrained over the medium-term.
Overall, there are encouraging signs that the office market is set to tighten over the coming years, which augurs positively for rental growth, occupancy, and asset values. That said, the pace of the recovery remains highly uncertain.
Dexus offers the most direct exposure to the office sector and currently trades at a 22% discount to NTA. However, the major diversified REITs – including Stockland, Mirvac, GPT Group, and Charter Hall – each maintain varying degrees of office exposure.
Residential – Rate Cuts to Reignite the Housing Market
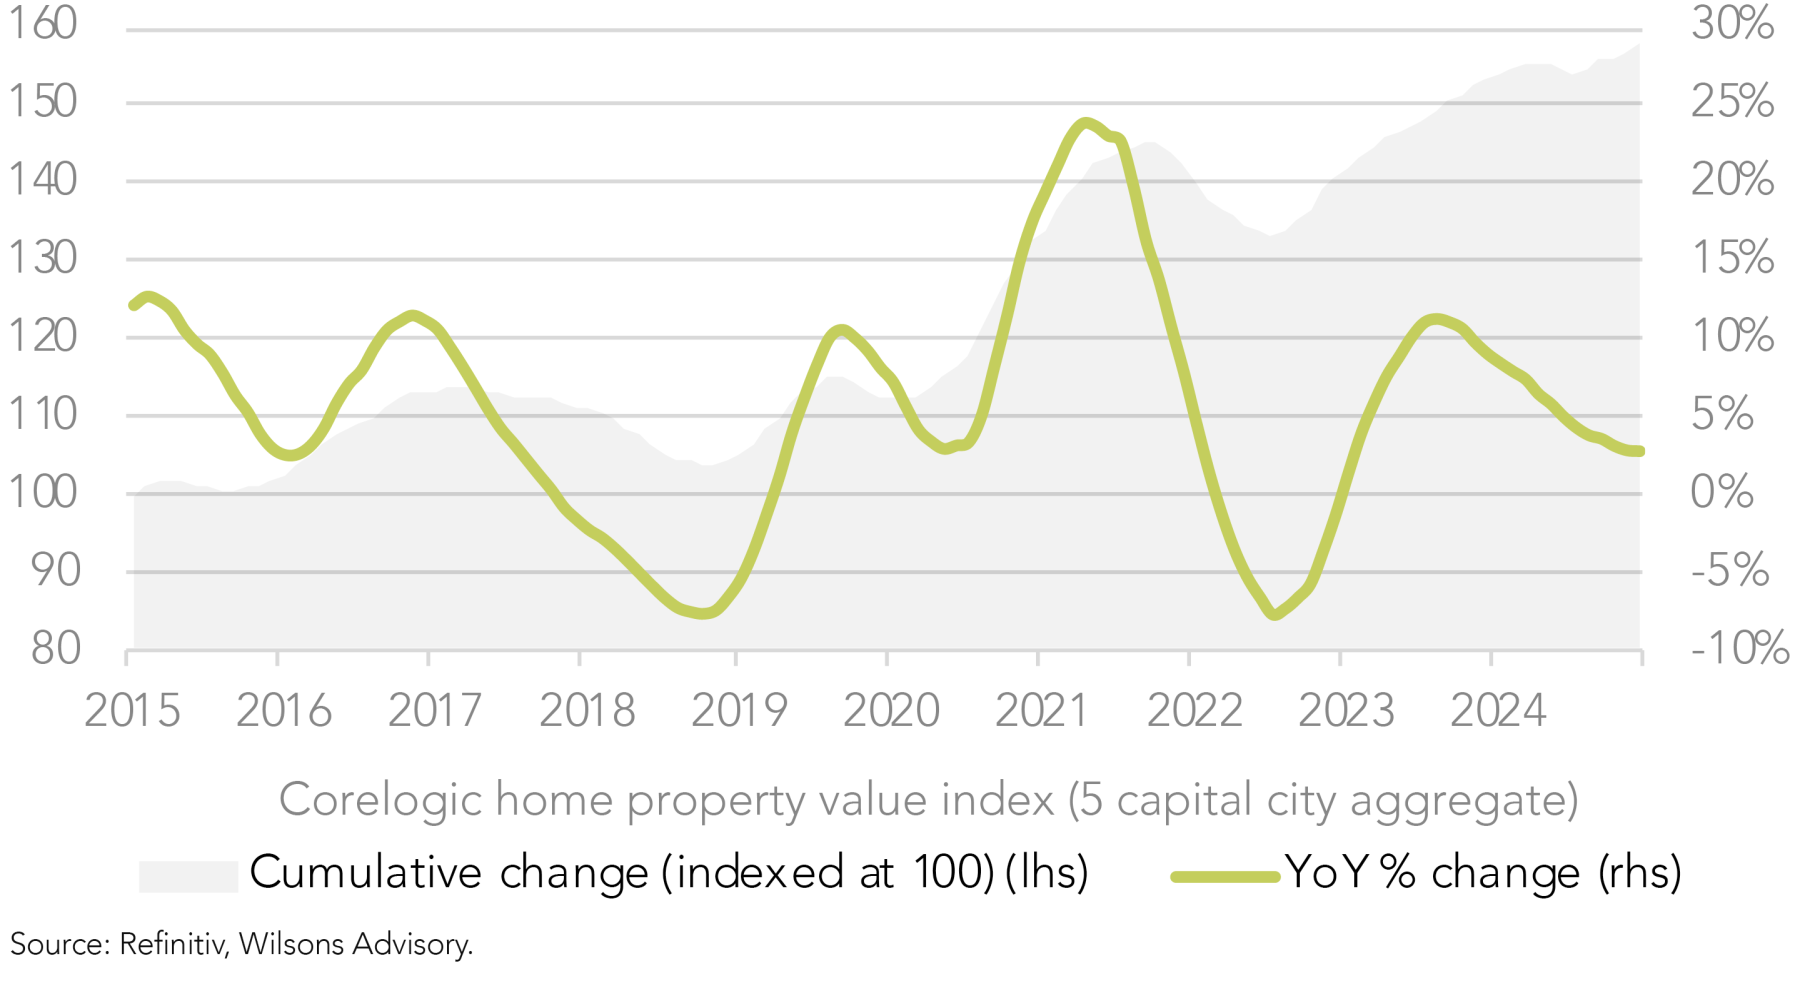
The Australian housing market is underpinned by a confluence of structural factors that have driven substantial appreciation in home prices over the past decade. These include strong population growth driven by high net overseas migration, persistent supply constraints (elevated construction costs, restrictive zoning, and protracted planning processes), and policy settings that favour home ownership – such as negative gearing, the capital gains tax discount, and first home buyer grants.
From a cyclical perspective, we expect RBA rate cuts, combined with a tight labour market, improved buyer confidence and chronically low housing supply, to support a moderate acceleration in house price growth over the medium-term.
This backdrop stands to benefit property companies with exposure to the housing cycle, including Stockland (master planned communities, land-lease communities), Mirvac (master planned communities, build-to-rent apartments), Ingenia Communities (land-lease communities), and GemLife (land-lease communities).
Stockland – Leveraged to Improving Housing Market Fundamentals
Stockland (not held) offers the greatest exposure to the expected housing market recovery as Australia’s leading residential developer with a heavy weighting to master planned communities, where demand is typically highly elastic to the residential price cycle.
While Stockland trades at a 23% premium to NTA – reflecting its development skew – it offers relative value on a price/AFFO basis, trading at 17.6x versus Mirvac at 21.6x. This appears reasonable considering it is expected to deliver high-single-digit AFFO growth over the medium term, while the stock offers an attractive dividend yield of 5.1%.
Residential pipeline is well positioned for a housing recovery
Residential developments typically account for close to half of group earnings. Stockland’s development pipeline has expanded from $30bn in 2021 to $49bn currently, with its number of active communities growing from 27 to 55 in this period.
The group has significant exposure to master planned communities (MPCs) and a growing footprint in land-lease communities (LLCs), with projects concentrated in key growth corridors in Sydney, Melbourne and Southeast Queensland.
The recent acquisition of Lendlease Communities will lift annual settlements from 5.6k in FY24 to 7.5–8k by FY26. While MPCs remain the core focus, LLCs are a growing focus of Stockland’s given their structurally attractive profile – offering higher margins, lower turnover, and strong demographic support from downsizers amidst affordability pressures.
Focused capital allocation strategy
Stockland is pivoting away from Retail and Retirement (targeting <30% exposure) toward Residential and Logistics. This has been demonstrated by its Retirement Living divestment, the acquisition of 12 residential projects through the Supalai JV and the Lendlease Communities acquisition.
Its capital partnership model enables recycling into its development pipeline, while maintaining gearing within its 20–30% target (currently around the mid-point). Since FY22, Stockland has completed seven capital partnerships, including recent deals with KKR and M&G in Logistics.
Retail – Recovery Underway
The retail property sector is beginning to see a resurgence in foot traffic, tenant sales volumes, and rental growth, after a softer period caused by a subdued consumer backdrop. However, a clear bifurcation has emerged between Tier 1 regional shopping malls – which have led the recovery – and lower-tier centres, which continue to face challenges.
The outlook for tenant demand in well-located, prime retail assets remains robust, supported by the prospect of several interest rate cuts over the coming year. While e-commerce continues to pose a long-term challenge, there is growing recognition among both retailers and investors that physical store networks in high-quality, ‘destination’ centres can enhance brand visibility, support last-mile logistics, and complement digital channels as part of an integrated omnichannel strategy.
Meanwhile, new supply remains limited, with very high barriers to entry and significant replacement costs supporting a favourable supply/demand dynamic among well-located assets. This should continue to support high occupancy levels and steady rental growth for prime regional shopping malls.
Scentre Group (not held), with its portfolio of flagship Westfield malls, is the highest quality retail landlord on the ASX and is well positioned to benefit from the ongoing retail recovery. The group enjoys high occupancy, prime retail locations, and disciplined capital management. The stock trades broadly in line with NTA – suggesting much of the recovery is already priced in – although it offers a solid 4.9% dividend yield and is expected to deliver mid-single-digit AFFO growth over the medium-term.
Industrial – Growth is Moderating but Fundamentals Remain Solid
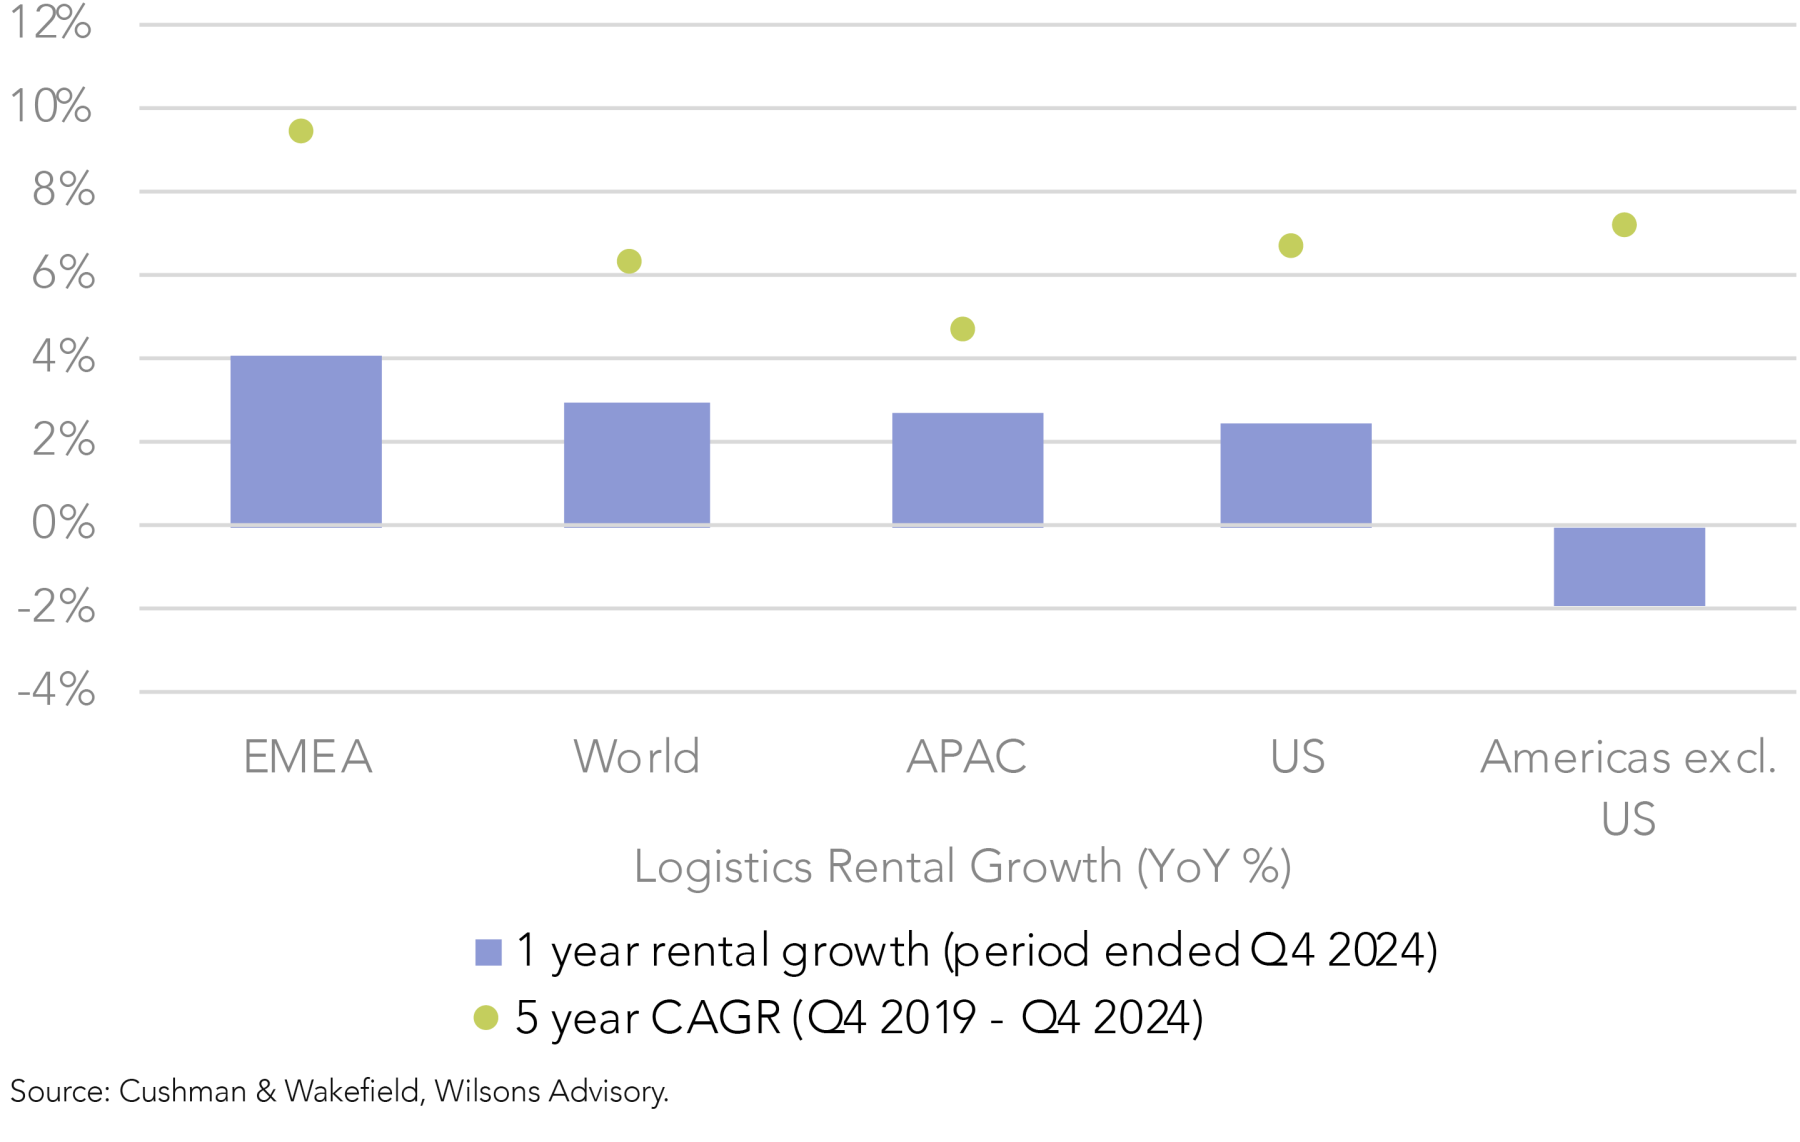
Industrial property continues to be supported by structural tailwinds, including the expansion of e-commerce, supply chain ‘nearshoring’, and growing demand for last-mile delivery and warehousing.
While rental growth has moderated from pandemic-era highs in 2022, sector fundamentals remain broadly positive across most Tier-1 industrial markets, both domestically and globally. Key markets remain relatively tight, with healthy tenant demand and structurally constrained supply keeping vacancy rates near historic lows, including at ~2.8% in Australia, well below the estimated ‘equilibrium’ level of 4%. Leasing conditions have also remained broadly favourable.
Overall, a tight supply/demand backdrop should continue to support healthy rental growth and asset valuations over the long-term.
Goodman Group (GMG) (Focus Portfolio 4%), as a global leader in logistics real estate development, offers the highest quality exposure to the industrial sector on the ASX. While the group is pivoting towards digital infrastructure, logistical warehouses remain a meaningful component of earnings.
Data Centres – AI Tailwinds are Building
The digital infrastructure sector remains in the early stages of its growth cycle, with data centre demand expected to grow substantially over the next decade, driven by three major structural tailwinds: 1) the ongoing transition to the cloud, 2) rapid adoption of Generative Artificial Intelligence (GenAI), and 3) exponential growth in global data creation and consumption.
There are two pure play exposures to the digital infrastructure thematic on the ASX 200: NextDC (albeit this is not formally classified as a REIT) and DigiCo Infrastructure REIT. In addition, Goodman Group (Focus Portfolio 4%) offers growing exposure to data centres, with 500MW of projects (~10% of its power bank) set to commence over the next 12 months, representing >50% of its development book.
Healthcare – Deep Value Emerging
Private hospitals are traditionally ‘defensive’ real estate assets, underpinned by structural tailwinds such as an ageing population, rising incidence of chronic disease, and increasing healthcare expenditure. However, operators have faced sustained margin pressure in recent years, as persistent cost inflation has outpaced revenue growth which is tied to private health insurer indexation.
This has eroded profitability across the sector, with Healthscope, one of Australia’s largest private hospital operators, facing significant profitability and solvency challenges, having recently entered into receivership.
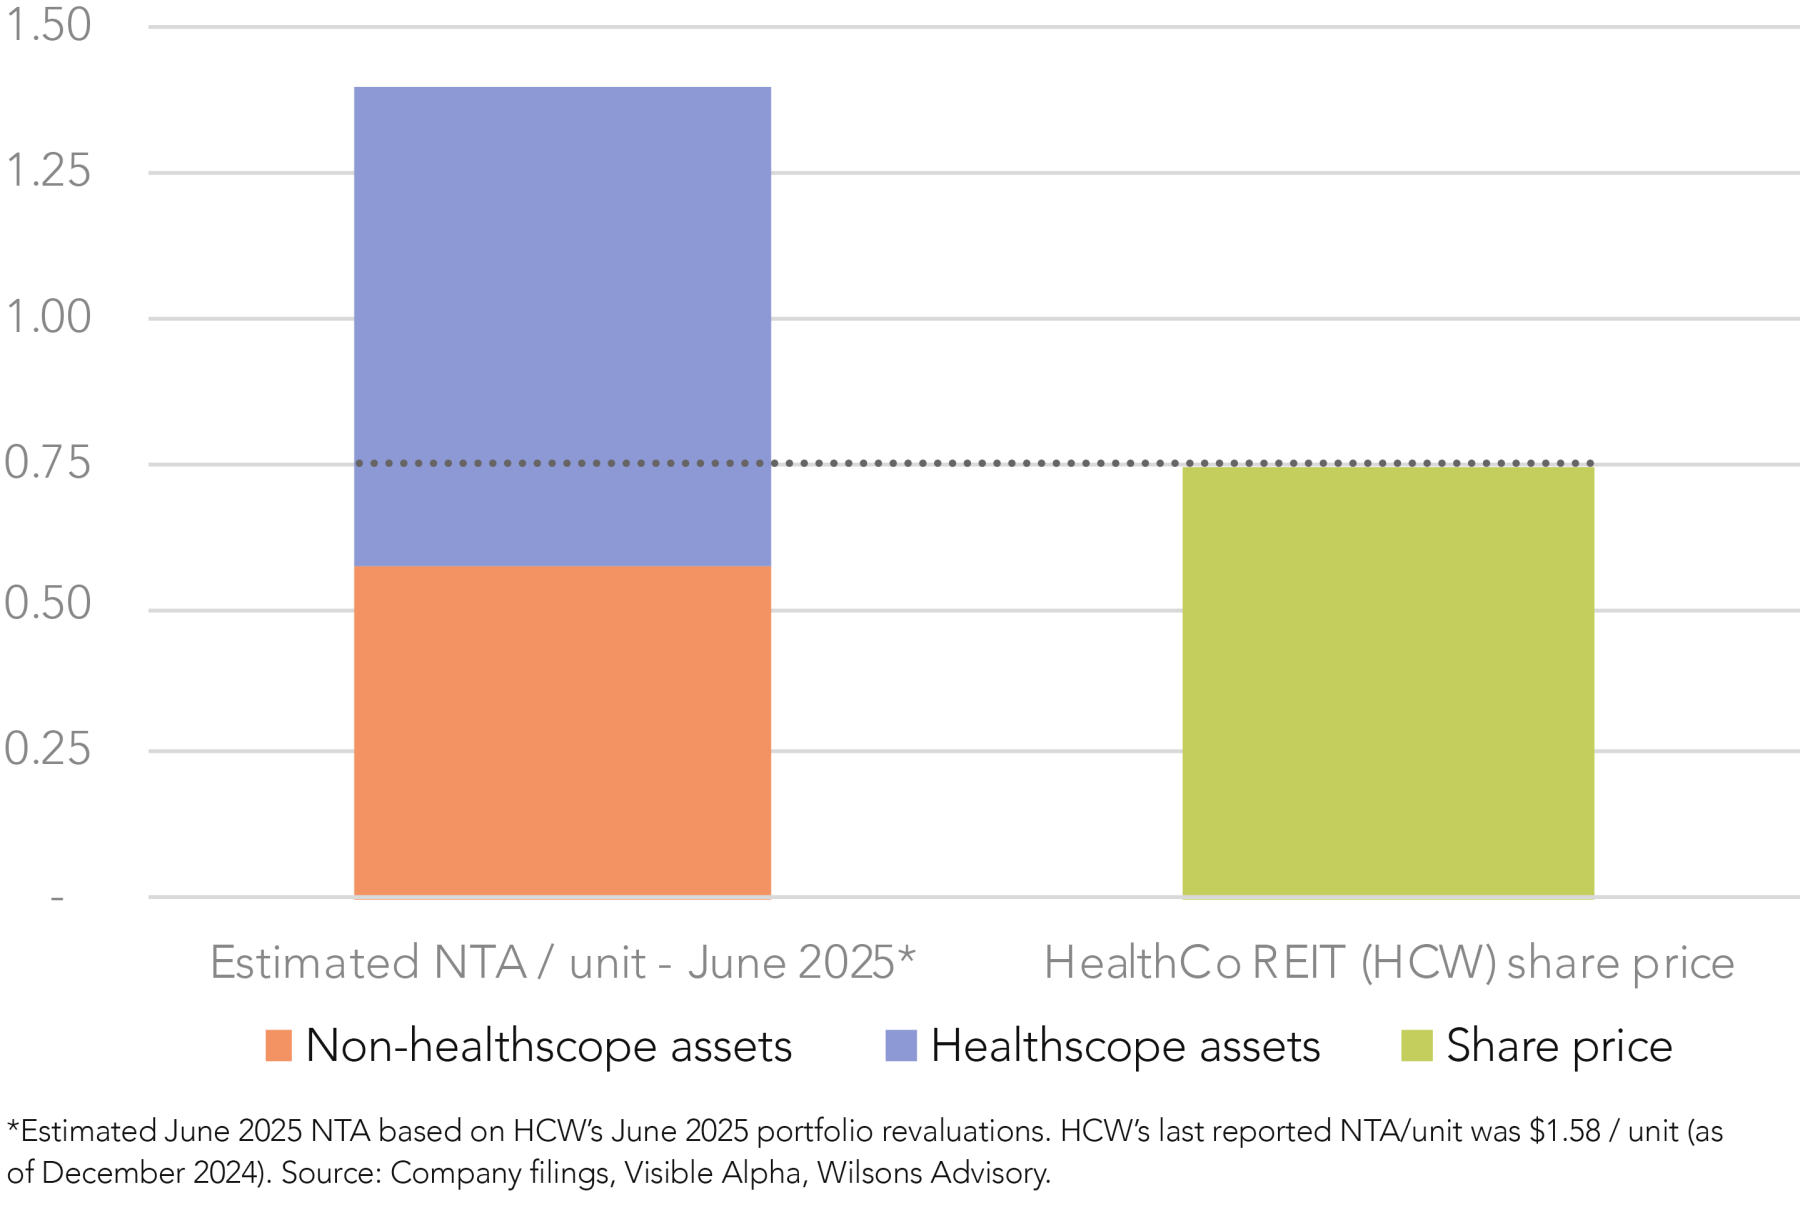
HealthCo Healthcare and Wellness REIT ('HealthCo REIT') (Focus Portfolio 3%) owns 11 hospitals leased to Healthscope. In its June 2025 portfolio revaluation, the A-REIT reported a -4.3% decline in asset values – likely reflecting uncertainty over the future of the Healthscope tenancies. Encouragingly, the A-REIT has confirmed that multiple alternative operators are conducting due diligence across all 11 sites, suggesting a path to resolution. Notwithstanding the uncertainty, HealthCo offers deep value at current levels – trading on a >50% discount to NTA, which implies little value for its Healthscope assets – and we expect the situation to be resolved soon.

Written by
Greg Burke, Equity Strategist
Greg is an Equity Strategist in the Investment Strategy team at Wilsons Advisory. He is the lead portfolio manager of the Wilsons Advisory Australian Equity Focus Portfolio and is responsible for the ongoing management of the Global Equity Opportunities List.
About Wilsons Advisory: Wilsons Advisory is a financial advisory firm focused on delivering strategic and investment advice for people with ambition – whether they be a private investor, corporate, fund manager or global institution. Its client-first, whole of firm approach allows Wilsons Advisory to partner with clients for the long-term and provide the wide range of financial and advisory services they may require throughout their financial future. Wilsons Advisory is staff-owned and has offices across Australia.
Disclaimer: This communication has been prepared by Wilsons Advisory and Stockbroking Limited (ACN 010 529 665; AFSL 238375) and/or Wilsons Corporate Finance Limited (ACN 057 547 323; AFSL 238383) (collectively “Wilsons Advisory”). It is being supplied to you solely for your information and no action should be taken on the basis of or in reliance on this communication. To the extent that any information prepared by Wilsons Advisory contains a financial product advice, it is general advice only and has been prepared by Wilsons Advisory without reference to your objectives, financial situation or needs. You should consider the appropriateness of the advice in light of your own objectives, financial situation and needs before following or relying on the advice. You should also obtain a copy of, and consider, any relevant disclosure document before making any decision to acquire or dispose of a financial product. Wilsons Advisory's Financial Services Guide is available at wilsonsadvisory.com.au/disclosures.
All investments carry risk. Different investment strategies can carry different levels of risk, depending on the assets that make up that strategy. The value of investments and the level of returns will vary. Future returns may differ from past returns and past performance is not a reliable guide to future performance. On that basis, any advice should not be relied on to make any investment decisions without first consulting with your financial adviser. If you do not currently have an adviser, please contact us and we would be happy to connect you with a Wilsons Advisory representative.
To the extent that any specific documents or products are referred to, please also ensure that you obtain the relevant disclosure documents such as Product Disclosure Statement(s), Prospectus(es) and Investment Program(s) before considering any related investments.
Wilsons Advisory and their associates may have received and may continue to receive fees from any company or companies referred to in this communication (the “Companies”) in relation to corporate advisory, underwriting or other professional investment services. Please see relevant Wilsons Advisory disclosures at www.wilsonsadvisory.com.au/disclosures.

