
The full-year reporting season kicks off this week and is all but certain to confirm a third consecutive year of flat-to-negative EPS growth for the ASX 200.
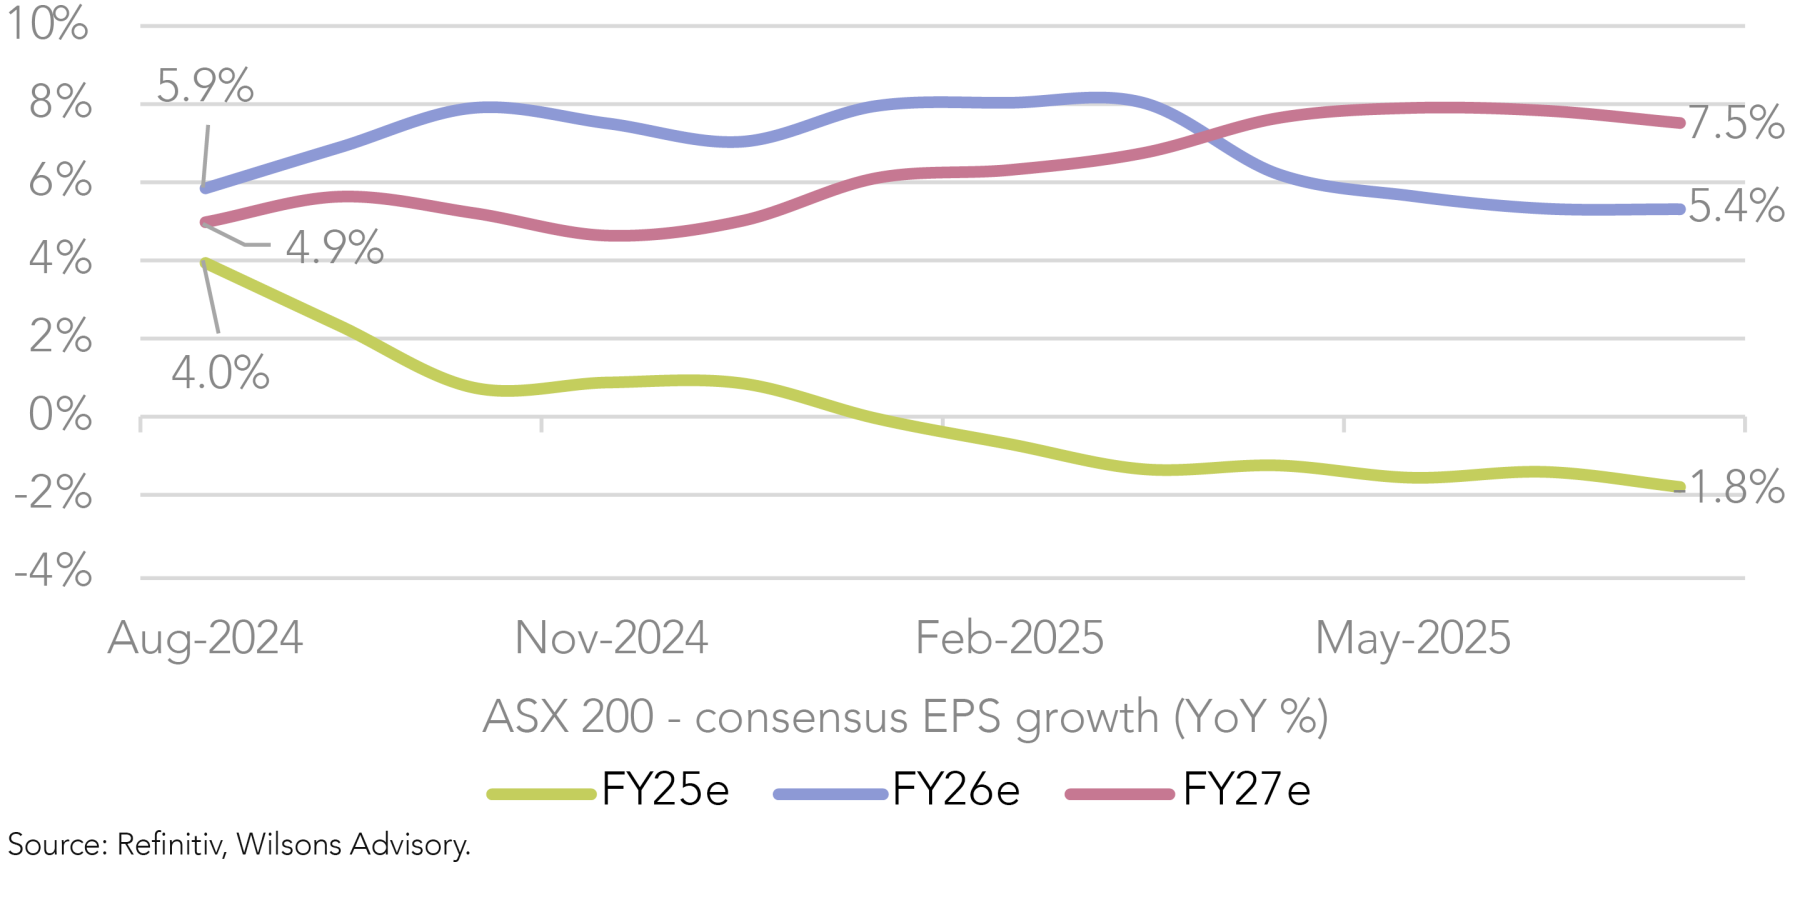
Since the interim reporting season in February, downgrades have outpaced upgrades by a ratio of 1.6:1 across the ASX 200, pushing aggregate EPS forecasts firmly into negative territory for FY25. That said, as we recently highlighted, there is no shortage of compelling growth stories across the ASX 200 at the sector and stock level, which we expect to be showcased this reporting season.
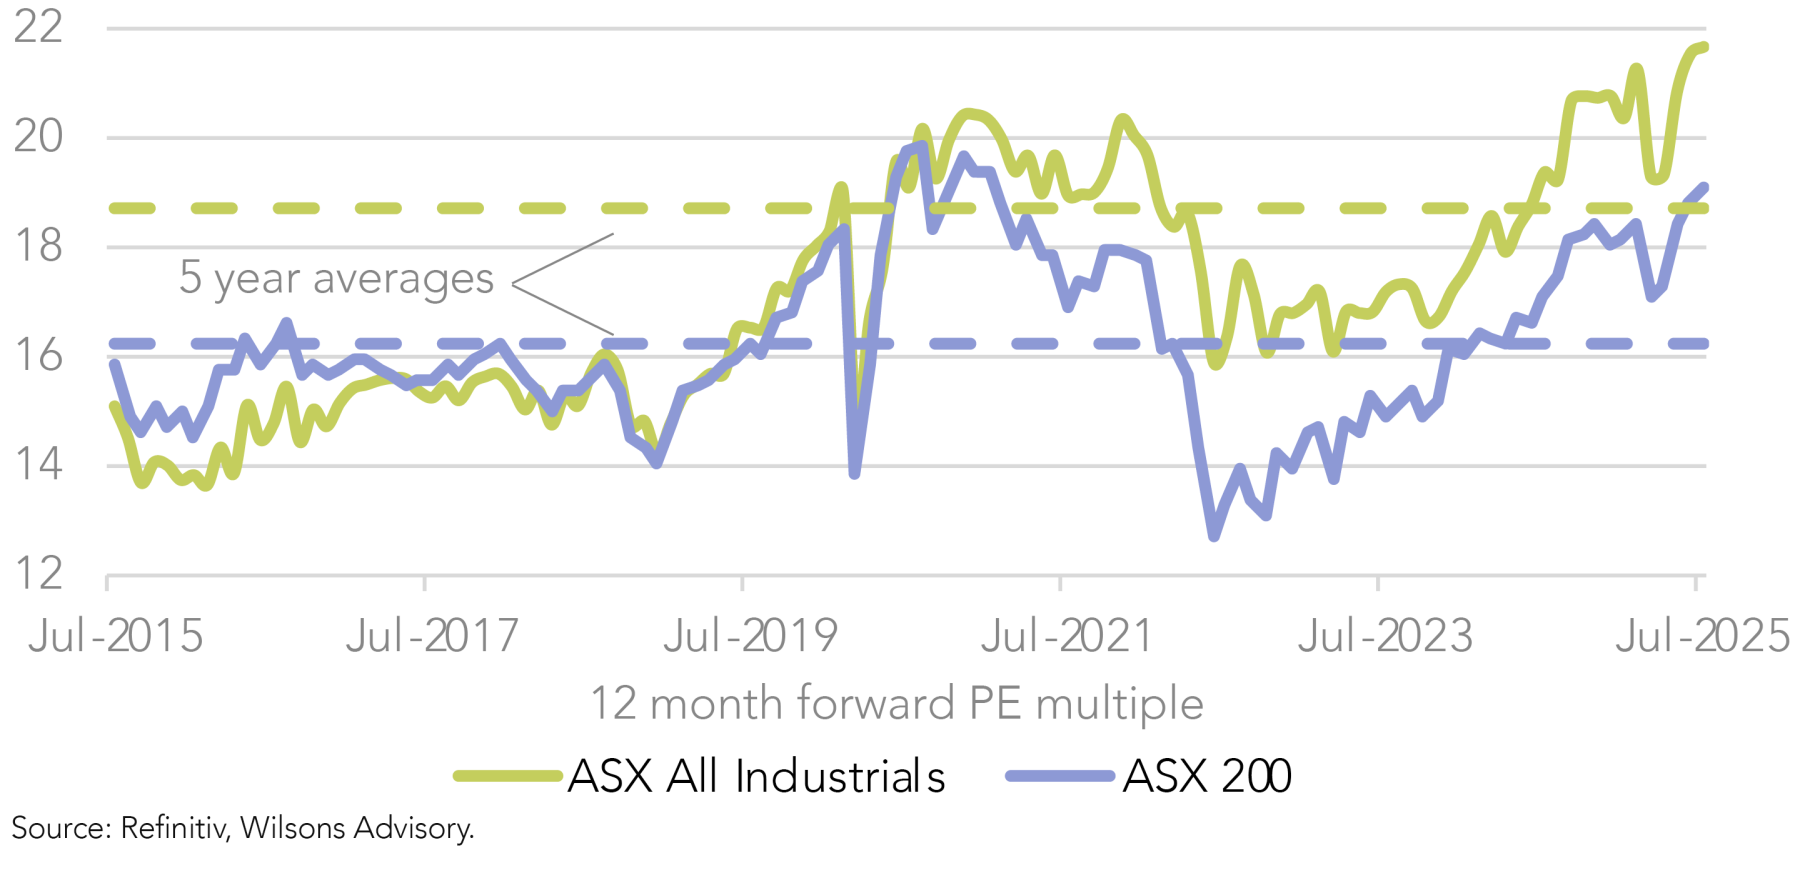
There continues to be a detachment between share prices, which have generally moved higher since April lows, and consensus earnings estimates, which have continued to drift lower in aggregate. This divergence has pushed market valuations higher. The ASX All Industrials Index (ex-resources) now trades at an all-time high forward PE multiple of 21.7x, and seven out of the eleven ASX 200 GICS sectors trade above their five-year averages – most notably IT and Financials (led by the banks).
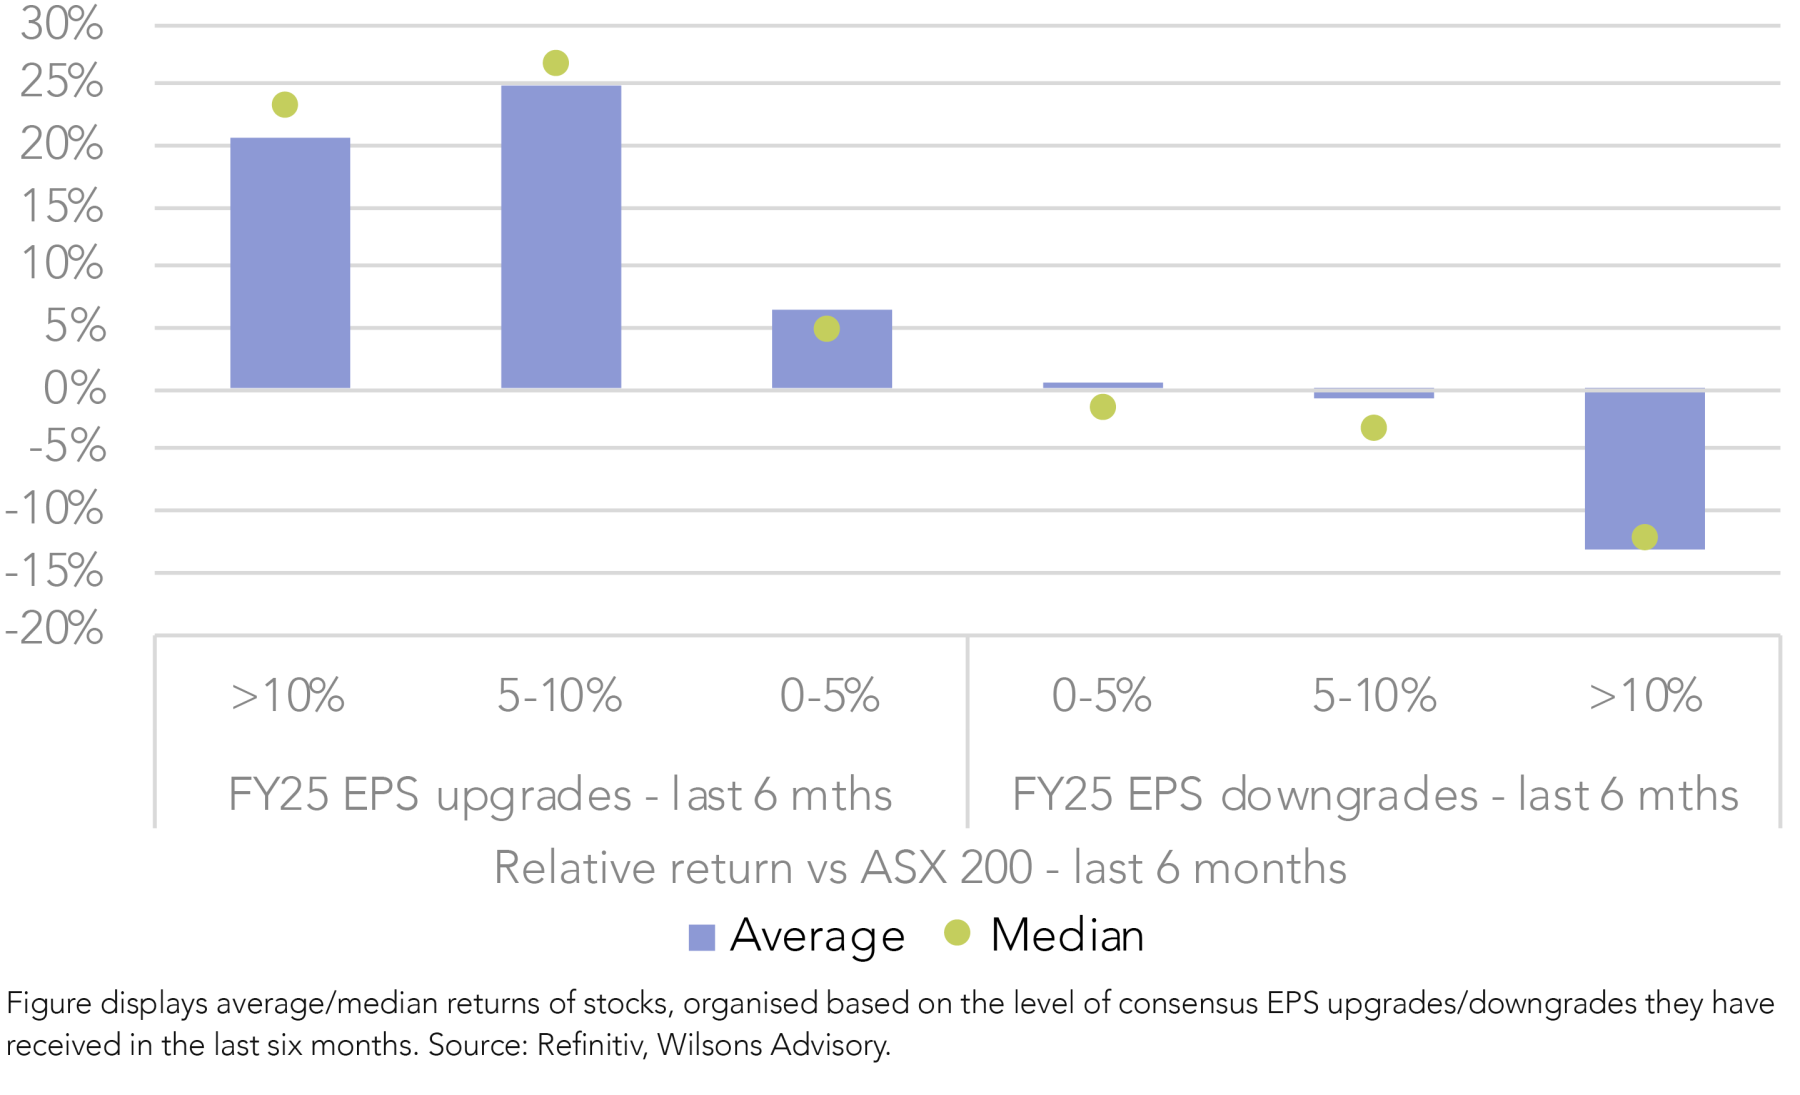
With valuations stretched across much of the market (notwithstanding a few exceptions), there is little room for error this reporting season, and earnings delivery will be critical. As shown in Figure 3, the market has punished earnings downgrades and rewarded upgrades over the last six months. We expect this dynamic to continue as full year results are released throughout August.
Following our top-down view of the ASX earnings outlook earlier this week (read here), this report provides a reporting season calendar, summarises our stock-specific views across the Focus Portfolio, and offers in-depth result previews for three top 20 ASX stocks – WiseTech, Woolworths, and CSL.
Reporting Season Calendar
| Company Name | Ticker | Portfolio Weight | Date | Period / report type | Preffered earnings* growth for period (vs pcp) | 12 mth fwd EPS revisions - last 3 months | Not held |
| Week 1 (and prior) | |||||||
| Macquarie Group | MQG | 3.0% | Thu 24 Jul | 1Q FY26 | na | -1% | |
| ResMed | RMD | 4.0% | Fri 01 Aug | FY25 | 24% | 3% | |
| Pinnacle Investment Management | PNI | 2.0% | Tue 05 Aug | FY25 | 59% | 5% | |
| Telstra | TLS | - | Fri 08 Aug | FY25 | 9% | 3% | x |
| Week 2 | |||||||
| CAR Group | CAR | 3.0% | Mon 11 Aug | FY25 | 10% | 2% | |
| Evolution Mining | EVN | 3.0% | Wed 13 Aug | FY25 | >100% | -2% | |
| Commonwealth Bank | CBA | - | Wed 13 Aug | FY25 | 6% | 1% | x |
| Westpac | WBC | 5.5% | Thu 14 Aug | 3Q FY25 | na | -2% | |
| Coles | COL | - | Thu 14 Aug | FY25 | 2% | 2% | x |
| ANZ | ANZ | 8.0% | Fri 15 Aug | 3Q FY25 | na | -2% | |
| HealthCo REIT | HCW | 3.0% | Fri 15 Aug | FY25 | 0% | -3% | |
| Week 3 | |||||||
| NAB | NAB | - | Mon 18 Aug | 3Q FY25 | na | 0% | x |
| BHP | BHP | 8.0% | Tue 19 Aug | FY25 | -22% | -1% | |
| CSL | CSL | 8.0% | Tue 19 Aug | FY25 | 9% | 3% | |
| HUB24 | HUB | 2.0% | Tue 19 Aug | FY25 | 38% | 11% | |
| Santos | STO | 3.5% | Wed 20 Aug | 1H FY25 | -37% | 2% | |
| Lottery Corp | TLC | 3.0% | Wed 20 Aug | FY25 | -11% | 2% | |
| James Hardie | JHX | 3.0% | Wed 20 Aug | 1Q FY26 | -10% | -7% | |
| Telix Pharmaceuticals | TLX | 3.0% | Thu 21 Aug | 1H FY25 | >100% | -5% | |
| Goodman Group | GMG | 4.0% | Thu 21 Aug | FY25 | 9% | 2% | |
| Brambles | BXB | 3.0% | Thu 21 Aug | FY25 | 14% | 4% | |
| Northern Star Resources | NST | 2.0% | Thu 21 Aug | FY25 | 87% | -24% | |
| Xero | XRO | 3.0% | Thu 21 Aug | AGM | na | -6% | |
| Week 4 (and beyond) | |||||||
| Wesfarmers | WES | - | Mon 25 Aug | FY25 | 3% | 0% | x |
| Woolworths | WOW | 4.0% | Wed 27 Aug | FY25 | -19% | 3% | |
| Wisetech Global | WTC | 3.0% | Wed 27 Aug | FY25 | 33% | 11% | |
| Worley | WOR | 3.0% | Wed 27 Aug | FY25 | 15% | -2% | |
| South32 | S32 | 3.0% | Thu 28 Aug | FY25 | nm | -10% | |
| Sandfire Resources | SFR | 3.0% | Thu 28 Aug | FY25 | nm | 12% | |
| Collins Foods | CKF | 3.0% | Mon 01 Sep | AGM | na | 0% | |
*Refers to the primary earnings measure used by investors/analysts when evaluating the performance of a company (which can differ by sector), as determined by Refinitiv. Focus Portfolio holdings Aristocrat and TechnologyOne are not scheduled to provide updates this reporting season. Source: Company filings, Refinitiv, Wilsons Advisory.
Key Result – WiseTech (WTC): Back to Business
| FY24a | FY25e | % YoY | |
| Revenue (US$m) | 683.7 | 797.1 | 17% |
| EBITDA (US$m) | 325 | 397.5 | 22% |
| Underlying NPAT (US$m) | 185.9 | 235.5 | 27% |
Source: Visible Alpha, Wilsons Advisory.
WiseTech has had a heavily disrupted nine month period, due to scandals related to founder Richard White’s personal life alongside associated product launch delays, governance concerns and board changes. We are now looking for WTC’s FY25 result to demonstrate a return to 'business as usual' under the recently announced CEO Zubin Appoo and the newly refreshed board.
In our view, an in-line result should be enough to refocus the market’s attention towards the company’s strong fundamentals and attractive medium/long-term growth story. We believe there is scope for WiseTech to surprise consensus to the upside at its FY25 result, particularly on margins.
Margin upside
In its 1H25 result, WTC demonstrated positive margin momentum, with its EBITDA margin expanding 5bps to 50%. The business also upgraded its FY25 margin guidance to the top end of its range (50-51%) despite downgrading its revenue guidance to the lower end of its 15-25% range. This demonstrates the positive progress WTC is making on its company-wide cost efficiency program, which has already exceeded its initial target of A$50m.
In our view, WTC’s aggressive push to ‘amplify and extend’ its use of AI tools to improve worker productivity – which last week it confirmed via internal emails will result in some roles becoming redundant – could yield greater cost savings than the market currently anticipates.
Other key items to watch:
- Product pipeline – after delays to the highly anticipated launch of Container Transport Optimisation (CTO) – the biggest driver of recent downgrades – the market will be looking for WTC to confirm the successful launch of the product in Australia in 2H25 and to reaffirm expectations for a wider global roll out over the medium-term.
- Customer wins – after announcing two top 25 global freight forwarder customer wins (Nippon Express and LOGISTEED) in its 1H25 result, a continuation of the recent cadence of major customer wins/rollouts would be well received by the market.
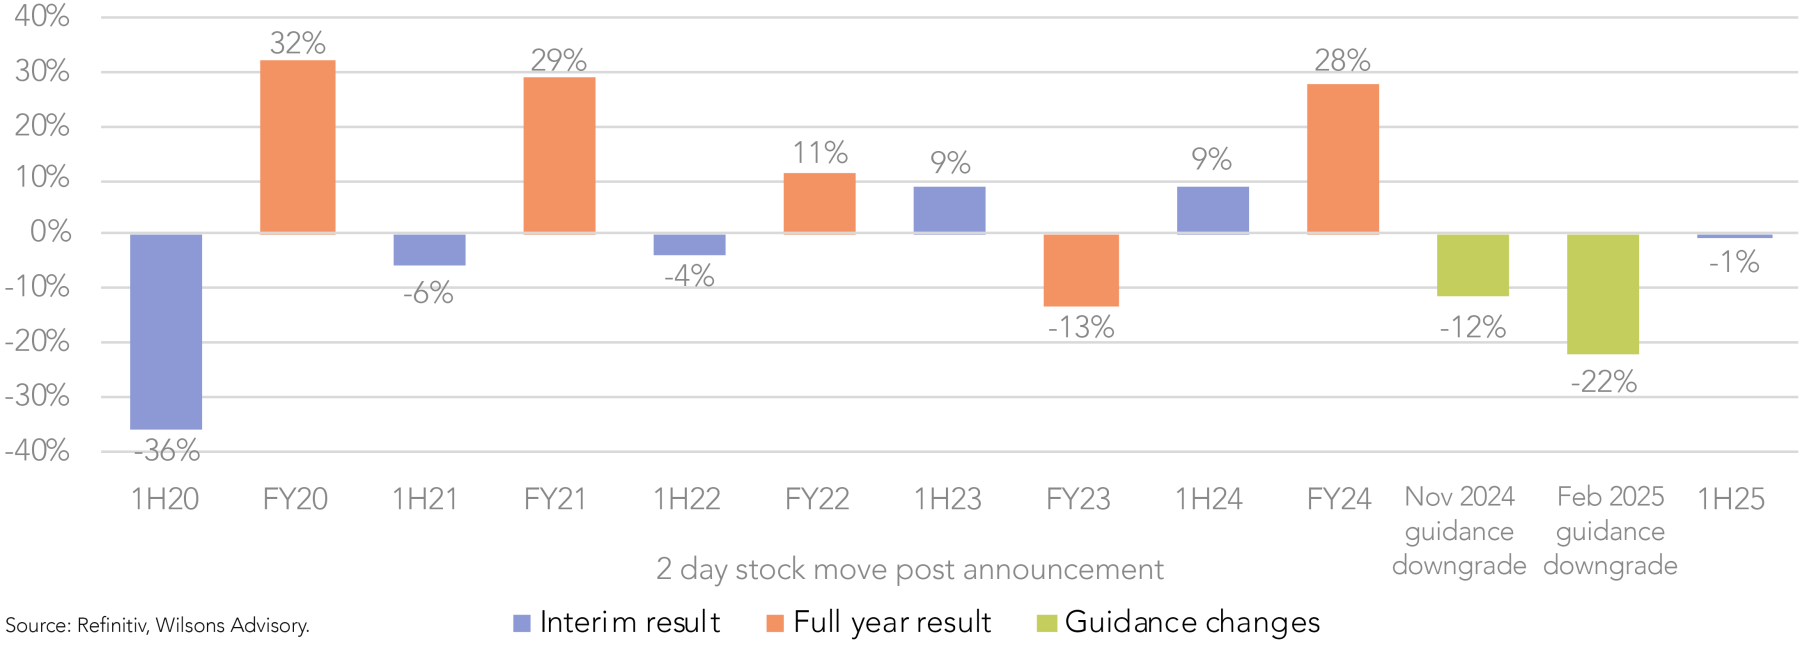
If WTC can deliver positive progress on margins, product rollouts, and customer wins – which we expect it to – the stock should perform well, as investor confidence should be restored in the quality of its platform and the strength of its long-term growth outlook. Given WTC trades on a premium forward PE of ~79x (in line with its five-year average), delivery against consensus will be crucial, particularly considering the stock’s historical volatility on results days, which suggests the release is likely to be met with a large share price reaction (see Figure 6).
Key Result – Woolworths (WOW): Better Days Ahead?
| FY24a | FY25e | % YoY | |
| Revenue (A$m) | 67,922 | 69,207 | 2% |
| EBIT (A$m) | 3,223 | 2,778 | -14% |
| Underlying NPAT (A$m) | 1,711 | 1,383 | -19% |
Source: Visible Alpha, Wilsons Advisory.
WOW has faced a multitude of headwinds in recent years, including subdued consumer spending, persistent cost/margin pressures, multiple ACCC investigations into the supermarket sector, intense public and media scrutiny, industrial action, and the departure of former CEO Brad Banducci.
However, we expect its FY25 result to demonstrate early signs of stabilisation, with a renewed focus on cost discipline and capital efficiency under new CEO Amanda Bardwell, who is set to deliver her inaugural full-year result. This shift should lay the foundation for improving operating margins and a return to positive earnings growth in FY26.
There are three key areas we are focused on for WOW this reporting season:
1. Market share recovery
Following a period of market share losses to Coles (alongside subdued top-line industry growth amidst cost of living pressure), we are looking for confirmation of improved sales momentum through Q4. In 3Q25, WOW's Australian Food like-for-like (LFL) sales growth of +3% was broadly in line with Coles, supported by a strategic price reset to improve affordability and its successful ‘Cubeez’ collectibles program which helped drive traffic. Sustained or accelerating sales growth, in line with or ahead of Coles, would reinforce the view that WOW’s in-store execution and brand health is improving and that market share losses have been stemmed.
2. Profitability and cost focus
Bardwell has entered the role of CEO with a renewed focus on profitability. WOW has announced a target of A$400m in annualised cost savings by end-2025. Beyond this, we see further cost rationalisation potential, noting WOW's store-level headcount is roughly double that of Coles, despite generating only 60% more in turnover, which points to an inflated cost base.
Key areas of potential include:
- Support office simplification
- Store productivity enhancements
- Supply chain automation/modernisation (e.g. Moorebank DC, Auburn CFC ramp-up)
- SKU and supplier rationalisation
- Better use of automation and digital analytics in inventory management
The announcement of further cost-out initiatives would be well supported by investors. Improved margin disclosure by business segment (e.g., online vs. store, food vs. non-food) would also be welcome, helping investors better assess progress.
3. Portfolio review
WOW has announced a strategic review of its underperforming and non-core segments, including Big W, NZ Food, and various digital ventures. The closure of loss-making MyDeal was a first step. However, we are looking for clearer signals of divestment or restructuring plans across the broader portfolio.
We would view the sale or spin-off of Big W and NZ Food positively, as this would be accretive to group returns on capital (ROFE) and simplify the business. A capital recycling strategy of divesting underperforming assets and reinvesting in higher-ROFE core segments would be well received by the market.
FY26 earnings recovery in focus
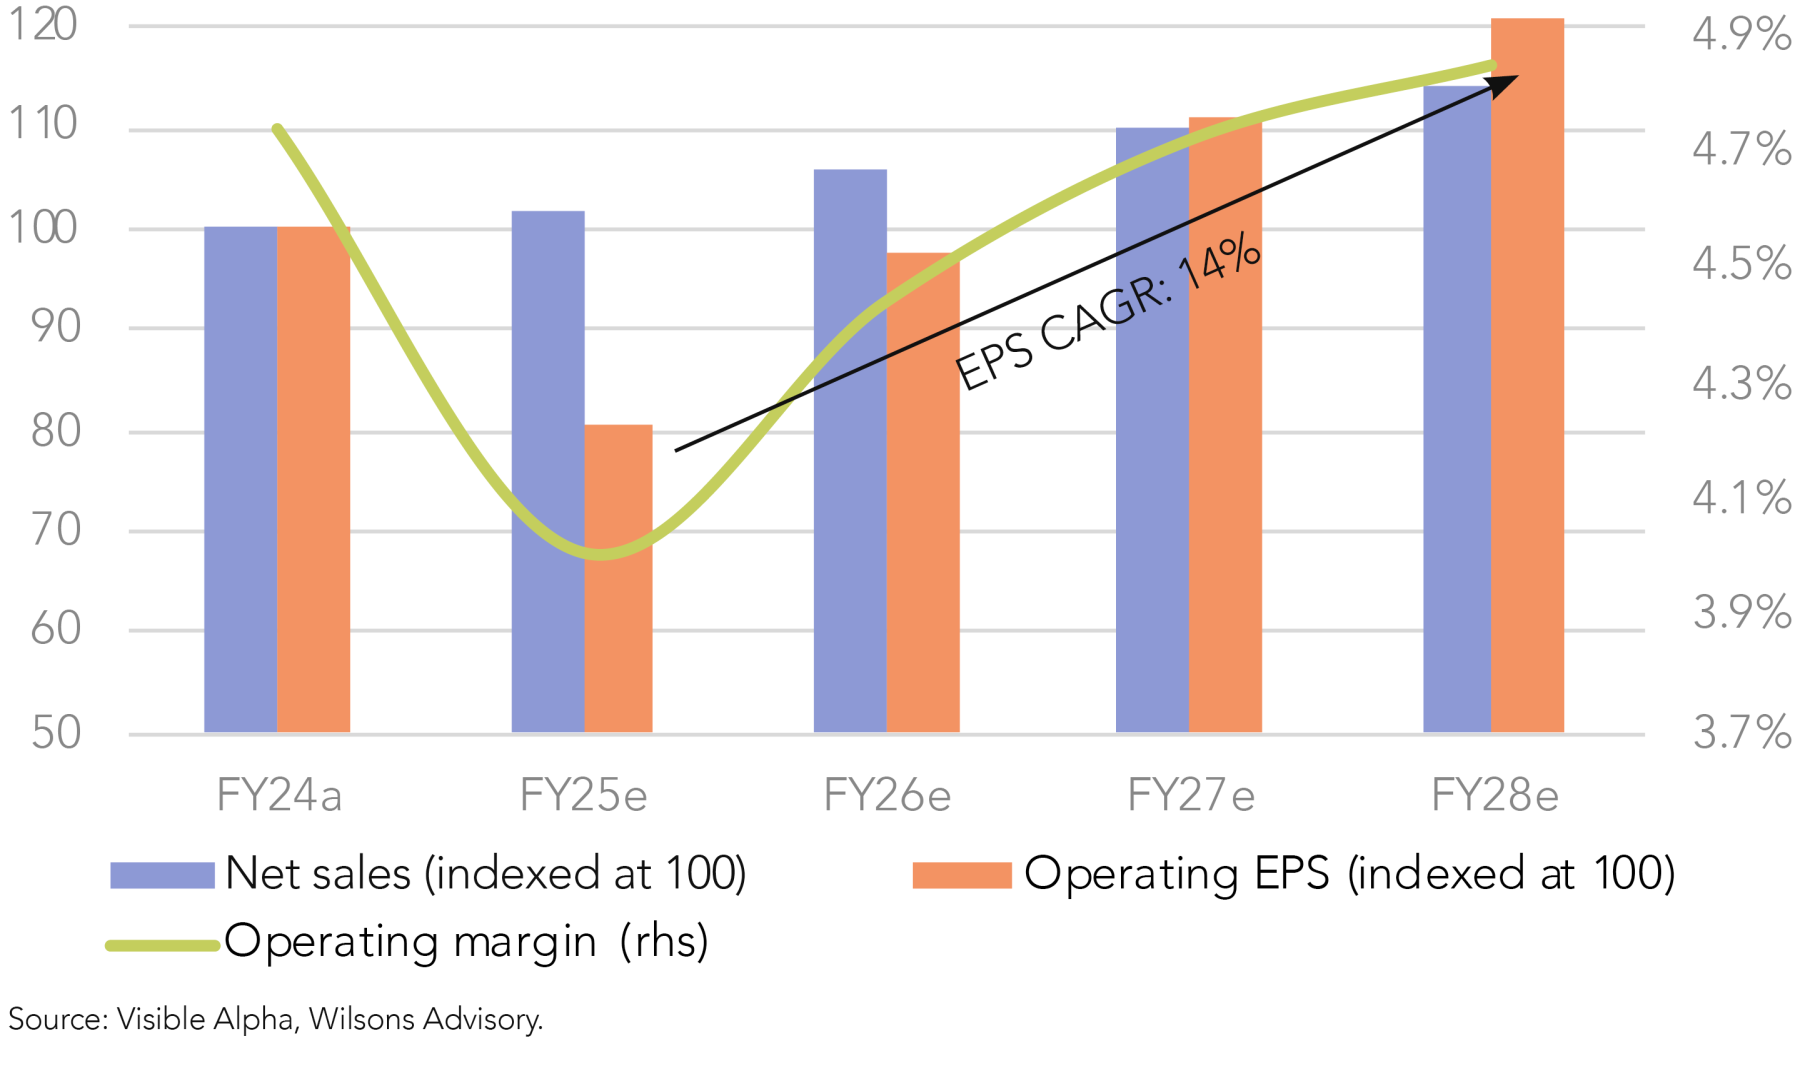
Overall, we are looking for Woolworths to show that operating conditions are stabilising and that management is actively laying the groundwork for improved margins over the medium term. This will be key to supporting investor confidence in the expected earnings inflection reflected in consensus estimates from FY26 onwards (see Figure 8). With WOW trading on a forward PE of ~22x – towards the lower end of its historical range – the stock offers attractive value considering consensus expectations of a mid-teens EPS CAGR over the medium term (providing consensus remains well supported).
Key Result – CSL: All Eyes on Behring
| FY24a | FY25e | % YoY | |
| Revenue (US$m) | 14,800.0 | 15,737.9 | 6% |
| Operating EBITDA (US$m) | 4,834.0 | 5,274.7 | 9% |
| Operating NPATA (US$m) | 2,907.0 | 3,170.8 | 9% |
Source: Visible Alpha, Wilsons Advisory.
After a period of underwhelming operational and share price performance, CSL’s FY25 result offers a critical opportunity to re-establish confidence in the company’s earnings trajectory.
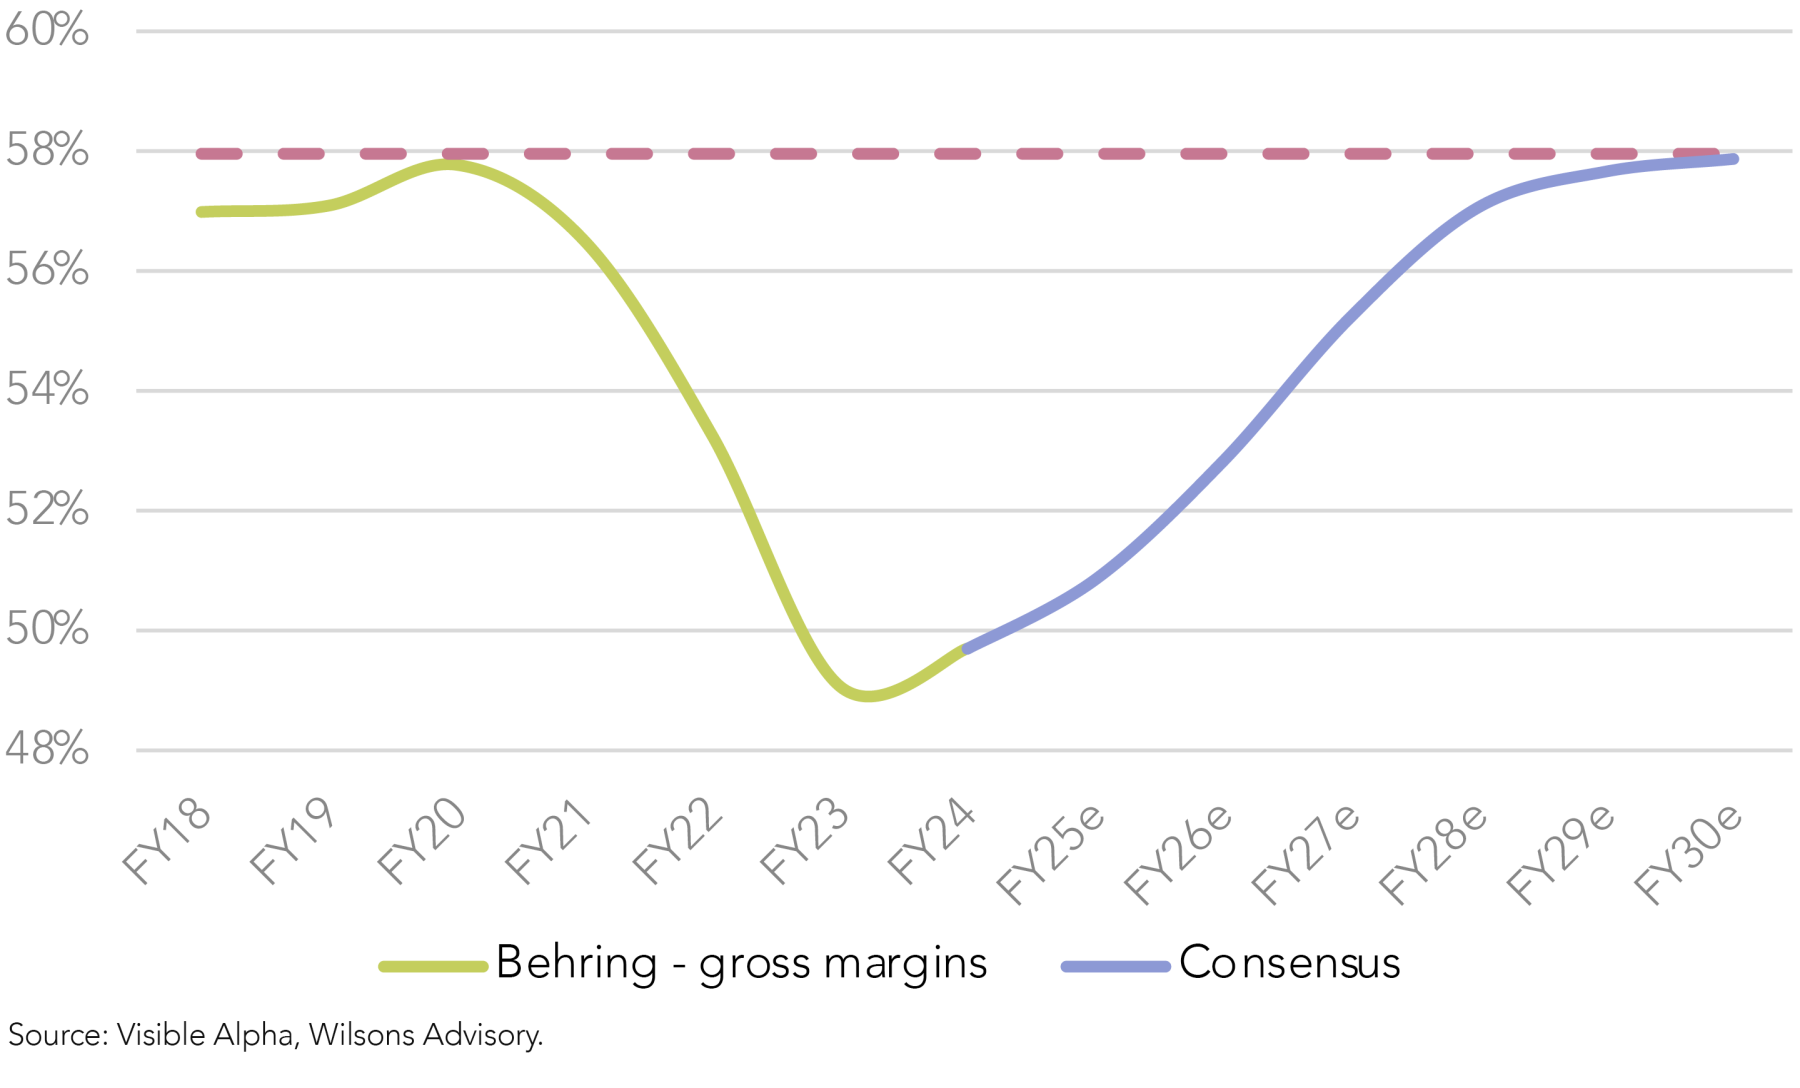
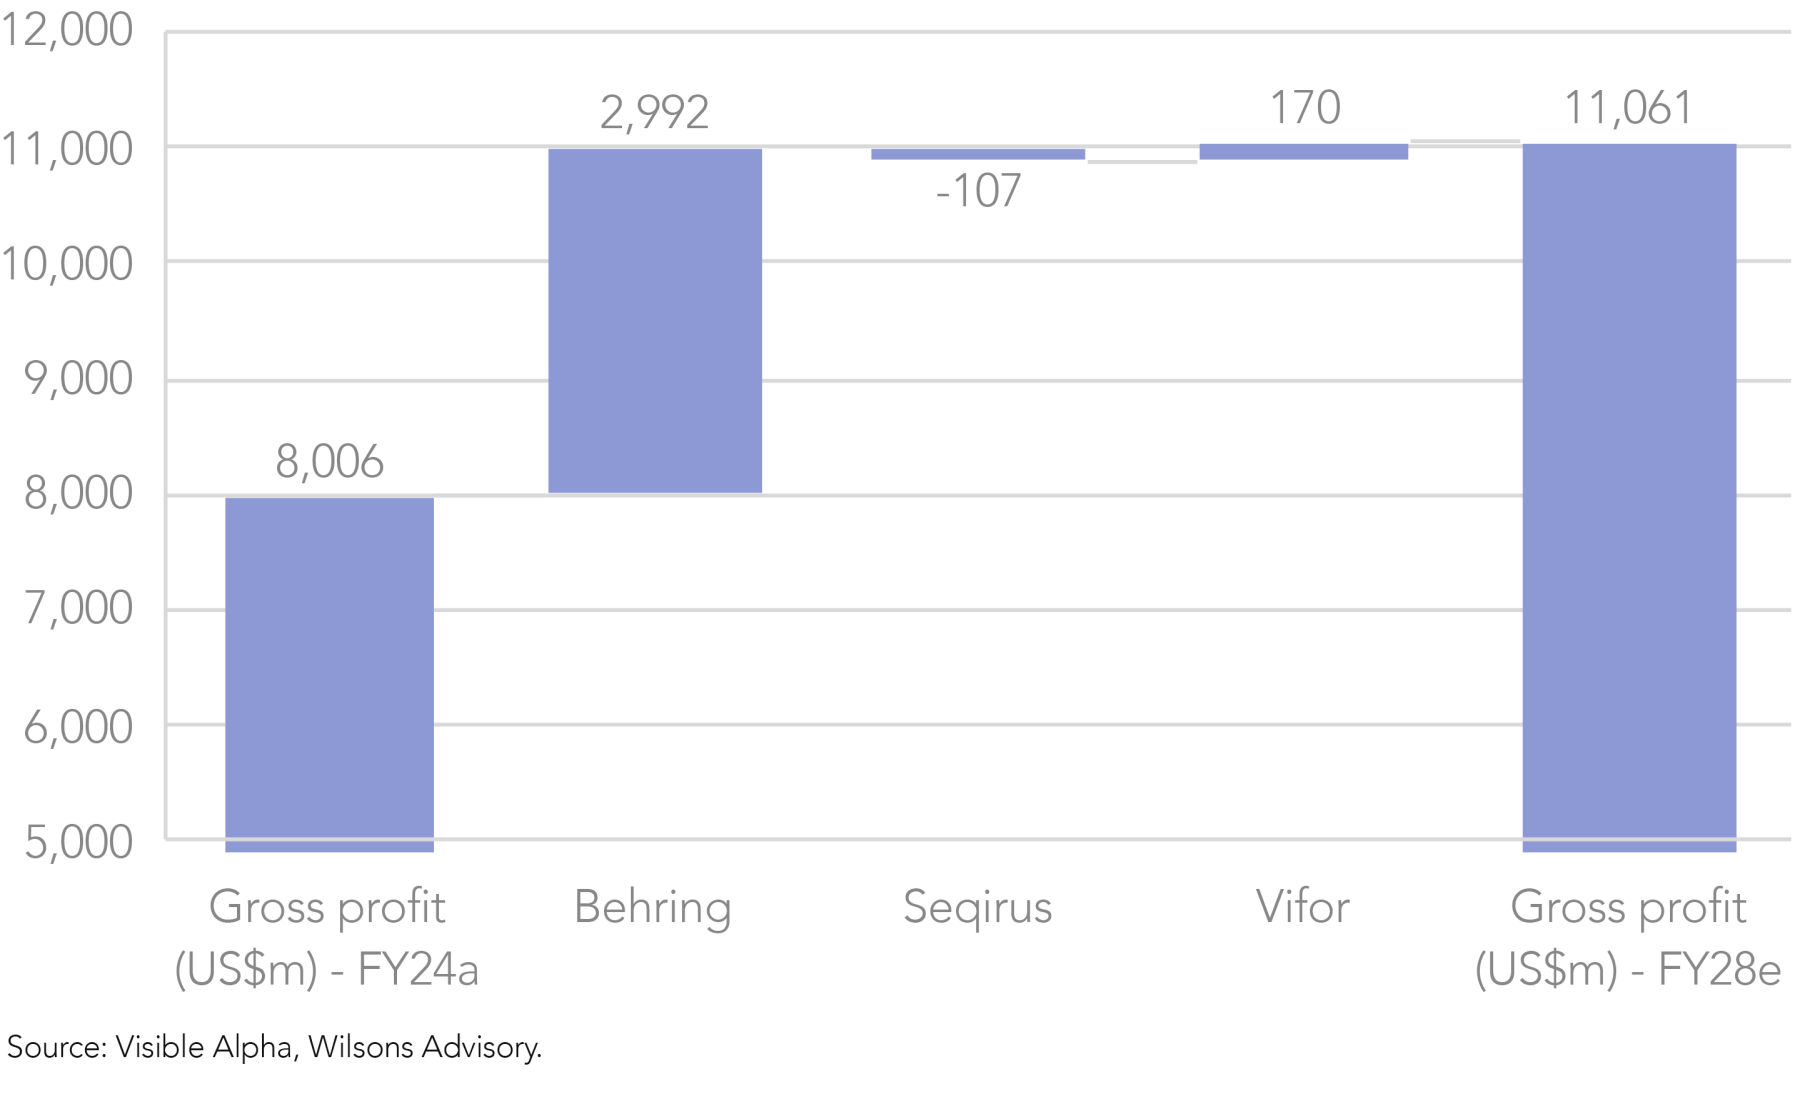
While a lot of attention has been given to the challenges and risks facing Vifor (i.e. generic competition in iron infusions) and Seqirus (i.e. falling US vaccination rates), the key to CSL’s earnings story remains the recovery of Behring’s gross margins to pre-Covid levels (~58%).
Central to this recovery is the rollout of the Rika plasma collection system. Rika’s personalised process, shorter collection times (down to 35 minutes), and improved yields (+10% plasma volumes) are expected to materially reduce Behring’s cost per litre and lift gross margins.
With Rika now fully deployed across the US (as of June 2025), we are looking for tangible evidence of its margin benefits in the FY25 result to support our investment thesis. Beyond Rika, margin expansion should also be supported by volume/scale processing efficiencies, the growth of high margin products including HEMGENIX and ANDEMBRY, and further mix shifts towards HIZENTRA.
Delivery will be key...
Consensus expects Behring’s gross margins to lift from 49.7% in FY24 to 50.9% in FY25 and 52.9% in FY26. If CSL can meet these expectations and begin to restore market confidence in its medium-term margin recovery and growth profile (with consensus factoring in a 15% EPS CAGR from FY25–28), the stock offers clear value at ~24x forward earnings.
That said, another earnings miss/downgrade would place greater pressure on CSL’s margin recovery narrative and cast doubt over the achievability of current consensus forecasts. While we remain constructive heading into the result, we are mindful that another underwhelming result may prompt a reassessment of our conviction in the business.
| Company Name | Ticker | Period / report type | ISG expectations |
| ANZ | ANZ | 3Q FY25 | ANZ's level of disclosure is likely to be limited in line with previous quarterly Basel III Pillar 3 disclosures, however, we expect ANZ's update to show a continuation of modest credit growth and benign arrears/bad debts. We would welcome colour on the new management's strategic focus, particularly around profitability enhancements and the ANZ Plus rollout. |
| BHP | BHP | FY25 | Key figures have been pre-released in BHP's June quarterly update, which included record iron ore and copper output. In FY26, BHP has guided towards CAPEX of A$11bn (vs A$10bn in FY25), flat iron ore volumes, and slightly weaker copper volumes due to declining grades at Escondida. |
| Brambles | BXB | FY25 | We expect mid-single digit revenue growth, and low-double digit NPAT growth supported by operating leverage and productivity initiatives. Our focus in the result will be on how sales volumes are faring amidst the uncertain macro, BXB’s progress on asset efficiency (automation/digitalisation) initiatives and their impact on NPAT/FCF margins, and the outlook for CAPEX (expect a CAPEX holiday if demand materially softens, but this could be offset by the recent uptick in lumber price inflation). |
| CAR Group | CAR | FY25 | Earlier this month, CAR provided preliminary estimates of its FY25 results, which was in line with consensus expectations for FY25 proforma revenue, EBITDA, and NPAT. Accordingly, our key focus will be on CAR's FY26 guidance statements, where are particularly interested in the outlook of the US segment where macro headwinds have been strongest. Management has already stated it believes the group is 'well positioned to deliver excellent results' in FY26, however, the devil will be in the detail. |
| Collins Foods | CKF | AGM | Following its FY25 result in May, CKF may provide a trading update for Q1 FY26, which we'd expect to show a continuation of positive same-store sales growth and margin improvements. CKF's current FY26 guidance is for ‘low to mid-teens’ underlying NPAT growth in FY26. |
| CSL | CSL | FY25 | Our key focus for CSL in its FY25 result will be on Behring's gross margins. With Rika now fully deployed in the US, we expect to see tangible benefits to its collection costs and gross margins. Behring's margin recovery remains central to our investment thesis for CSL. |
| Evolution Mining | EVN | FY25 | Key figures have been pre-released in EVN's June quarterly update, which was in line with expectations. FY26 guidance is for flat copper/gold volumes, a -20% decline in CAPEX vs FY25, and moderately higher unit costs due to the processing of lower grade stockpiled ore built up in FY25. |
| Goodman Group | GMG | FY25 | We are confident GMG will meet, or modestly beat, its guidance, which is for operating EPS growth of +9%. We expect the result to demonstrate inflecting development yields reflecting (higher margin) data centre commencements. The market will be looking for further colour on its 5GW data centre pipeline (with 0.5GW due to commence by mid-2026). |
| HealthCo REIT | HCW | FY25 | We are primarily looking for positive progress on the replacement of Healthscope's tenancies. Following HCW's June 2025 portfolio revaluations (book values -4.3%), we expect NTA to decline from $1.58/sh (as of Dec 2024). After withdrawing its FY25 guidance, we expect to HCW to withhold its dividend and preserve capital until the Healthscope assets are re-tenanted. |
| HUB24 | HUB | FY25 | With June FUM figures already pre-released, our key focus is on reinvestment commentary - if HUB pares back its reinvestment, this could underpin meaningful operating leverage / margin expansion, potentially driving consensus upgrades. HUB's June quarter update was strong, with continued strength in net flows, at $4.1bn, driven by market movement of +4.8% and EQT migration of $1.2bn driving record FUA of $112.7bn. |
| James Hardie | JHX | 1Q FY26 | We are looking for JHX to reaffirm its guidance, which is for a low single-digit decline in volumes and low single-digit sales/EBITDA growth. We expect the Q1 update to reflect immediate headwinds facing US home construction and ongoing macro uncertainty. We are looking for a continuation of above-system growth (share gains) and cost control to partially offset the tough macro. |
| Macquarie Group | MQG | 1Q FY26 | Already released. Macquarie's 1Q26 update was qualitatively soft, with net profit contribution down vs pcp driven by weakness in MAM and CGM. We remain cautious around near-term consensus risks, with the street forecasting NPAT growth of +20% in 1H26 (despite NPAT being down vs pcp in Q1). |
| Northern Star Resources | NST | FY25 | Key figures have been pre-released in NST's June quarterly update, with FY26 guidance re-setting consensus expectations lower (higher CAPEX + costs). Despite the weaker than expected guidance, NST continues to offer the most attractive free cash flow yield over the medium-term, underpinned by its strong production growth outlook. |
| Pinnacle Investment Management | PNI | FY25 | We expect a strong result driven by positive inflows/FUM growth and solid growth in performance fees. Our research team forecasts: i) $171.5b of FUM, ii) Q4 Net Inflows of $4.3b led by Life Cycle, iii) Gross Performance Fees of $43.9m ($11.4m net) and Reported NPAT of $133.6m. |
| ResMed | RMD | FY25 | We expect continued strength in sleep apnea patient starts and resupply, as well as further gross margin expansion (in line with its target of above 60%) supported by manufacturing scale benefits and mix-shifts associated with the rollout of AS11. Together, these factors underpin expectations of double-digit EPS growth in FY25 and over the medium-term. |
| South32 | S32 | FY25 | Key figures have been pre-released in S32's June quarterly update, which saw FY25 volumes +2% above consensus while costs were mostly in line. FY26 production guidance is also largely unchanged, albeit there is uncertainty around the outlook for Mozal (with the current power contract set to end in March 2026) and Cannington (where production is being reviewed due to increasing mine complexity). |
| Sandfire Resources | SFR | FY25 | Key figures have been pre-released in SFR’s June quarterly update, with revenue, EBITDA and copper equivalent (CuEq) production in line with expectations. Furthermore, the midpoint of FY26 CuEq guidance of 149-165kt was also in line. Management flagged a ~10% increase in Motheo’s unit costs in FY26 due to the ramp up of the A4 open pit mine. |
| Santos | STO | 1H FY25 | TLC's FY25 result will likely show a decline in earnings vs FY24 as it cycles a record jackpot cycle. We are looking for further colour on planned game innovations and evidence of a stabilisation in digital share. With leverage heading below its target range, TLC has balance-sheet optionality for capital management (albeit we note it has no excess dividend-imputation capacity). |
| Lottery Corp | TLC | FY25 | TLC's FY25 result will likely show a decline in earnings vs FY24 as it cycles a record jackpot cycle. We are looking for further colour on planned game innovations and evidence of a stabilisation in digital share. With leverage heading below its target range, TLC has balance-sheet optionality for capital management (albeit we note it has no excess dividend-imputation capacity). |
| Telix Pharmaceuticals | TLX | 1H FY25 | TLX recently released its Q2 trading update where it delivered US$204m in unaudited revenue, including US$154m from ILLUCCIX, which was in line with expectations, while FY25 revenue guidance of $770-800m was maintained. We are looking for further information on the SEC's subpoena related to its disclosures regarding the development of the company’s prostate cancer therapies (TLX591 and TLX592). |
| Westpac | WBC | 3Q FY25 | While WBC's level of disclosure will likely be limited given this is a quarterly update, we expect bad debts to remain subdued, while NIMs and operating costs present potential earnings headwinds amidst margin pressures and WBC's ongoing tech overhaul (UNITE). |
| Worley | WOR | FY25 | Despite an uncertain industry backdrop (volatile oil price, shifting climate goals), we expect WOR to meet consensus expectations of 10% EBITA growth and EBITA (ex-procurement) margin of 8.3%, given with its recent momentum of surprising to the upside on margins. WOR's management has reiterated they continue to take on higher margin work and their cost-efficient Global Integrated Delivery (GID) model will drive margin upside into the medium-term. |
| Woolworths | WOW | FY25 | WOW's FY25 result will see NPAT decline due to elevated cost pressures and other temporary headwinds. In the result, we are looking for further evidence of WOW's market share recovery in Aus Food, greater details on cost-out plans beyond the A$400m cost-out already announced, and further colour on the company's ongoing portfolio review of non-core assets. |
| Wisetech Global | WTC | FY25 | Despite two guidance downgrades over the last 9 months, we see upside risks to EBITDA margins at the FY25 result. We are also looking for colour on the rollout of CTO and evidence of continued customer wins. An‘in-line’ result should be enough to refocus the market’s attention towards the company’s strong fundamentals and attractive medium/long-term growth story. |
| Xero | XRO | AGM | We expect Xero to provide qualitative updates on business strategy and its medium-term aspirations, with a focus on the recently acquired Melio. |
Source: Refinitiv, Visible Alpha, Wilsons Advisory.

Written by
Greg Burke, Equity Strategist
Greg is an Equity Strategist in the Investment Strategy team at Wilsons Advisory. He is the lead portfolio manager of the Wilsons Advisory Australian Equity Focus Portfolio and is responsible for the ongoing management of the Global Equity Opportunities List.
About Wilsons Advisory: Wilsons Advisory is a financial advisory firm focused on delivering strategic and investment advice for people with ambition – whether they be a private investor, corporate, fund manager or global institution. Its client-first, whole of firm approach allows Wilsons Advisory to partner with clients for the long-term and provide the wide range of financial and advisory services they may require throughout their financial future. Wilsons Advisory is staff-owned and has offices across Australia.
Disclaimer: This communication has been prepared by Wilsons Advisory and Stockbroking Limited (ACN 010 529 665; AFSL 238375) and/or Wilsons Corporate Finance Limited (ACN 057 547 323; AFSL 238383) (collectively “Wilsons Advisory”). It is being supplied to you solely for your information and no action should be taken on the basis of or in reliance on this communication. To the extent that any information prepared by Wilsons Advisory contains a financial product advice, it is general advice only and has been prepared by Wilsons Advisory without reference to your objectives, financial situation or needs. You should consider the appropriateness of the advice in light of your own objectives, financial situation and needs before following or relying on the advice. You should also obtain a copy of, and consider, any relevant disclosure document before making any decision to acquire or dispose of a financial product. Wilsons Advisory's Financial Services Guide is available at wilsonsadvisory.com.au/disclosures.
All investments carry risk. Different investment strategies can carry different levels of risk, depending on the assets that make up that strategy. The value of investments and the level of returns will vary. Future returns may differ from past returns and past performance is not a reliable guide to future performance. On that basis, any advice should not be relied on to make any investment decisions without first consulting with your financial adviser. If you do not currently have an adviser, please contact us and we would be happy to connect you with a Wilsons Advisory representative.
To the extent that any specific documents or products are referred to, please also ensure that you obtain the relevant disclosure documents such as Product Disclosure Statement(s), Prospectus(es) and Investment Program(s) before considering any related investments.
Wilsons Advisory and their associates may have received and may continue to receive fees from any company or companies referred to in this communication (the “Companies”) in relation to corporate advisory, underwriting or other professional investment services. Please see relevant Wilsons Advisory disclosures at www.wilsonsadvisory.com.au/disclosures.

