
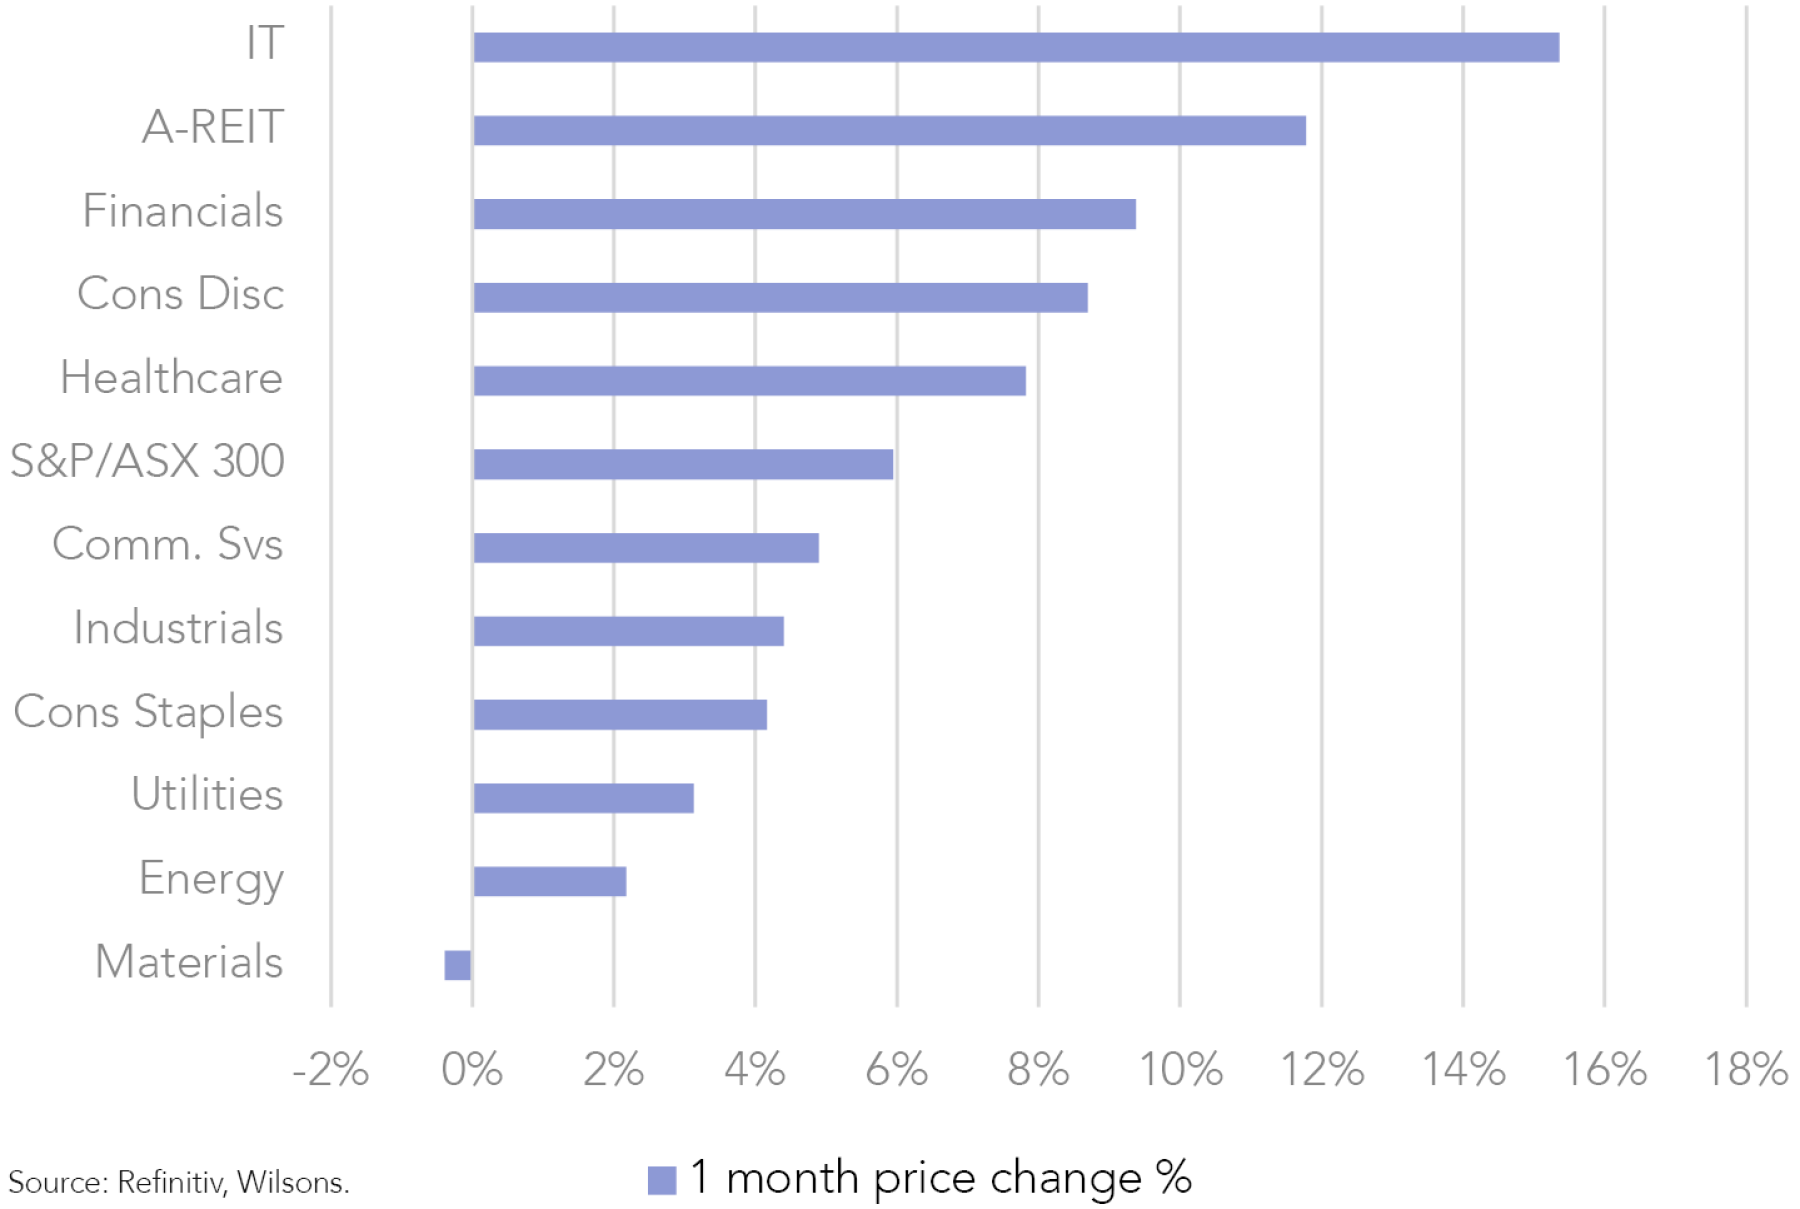
The Australian equity market finally caught a break in July, with a strong 5.9% increase in the ASX 300. This marked the best July since 2016.
The combination of easing interest rate pressures and a decent US earnings season helped fuel a US-led global equity rally, and the Australian market caught onto this wave of optimism.
We discuss the macro narrative behind the correction and subsequent rally in July below.

Bond-sensitive sectors, such as IT, REITs, and healthcare led the charge as initial interest rate expectations were revised downwards as the expected slowdown in world economic growth gathered pace. A bounce in financials (led by the big 4 banks) and the consumer discretionary sector also supported the overall market.
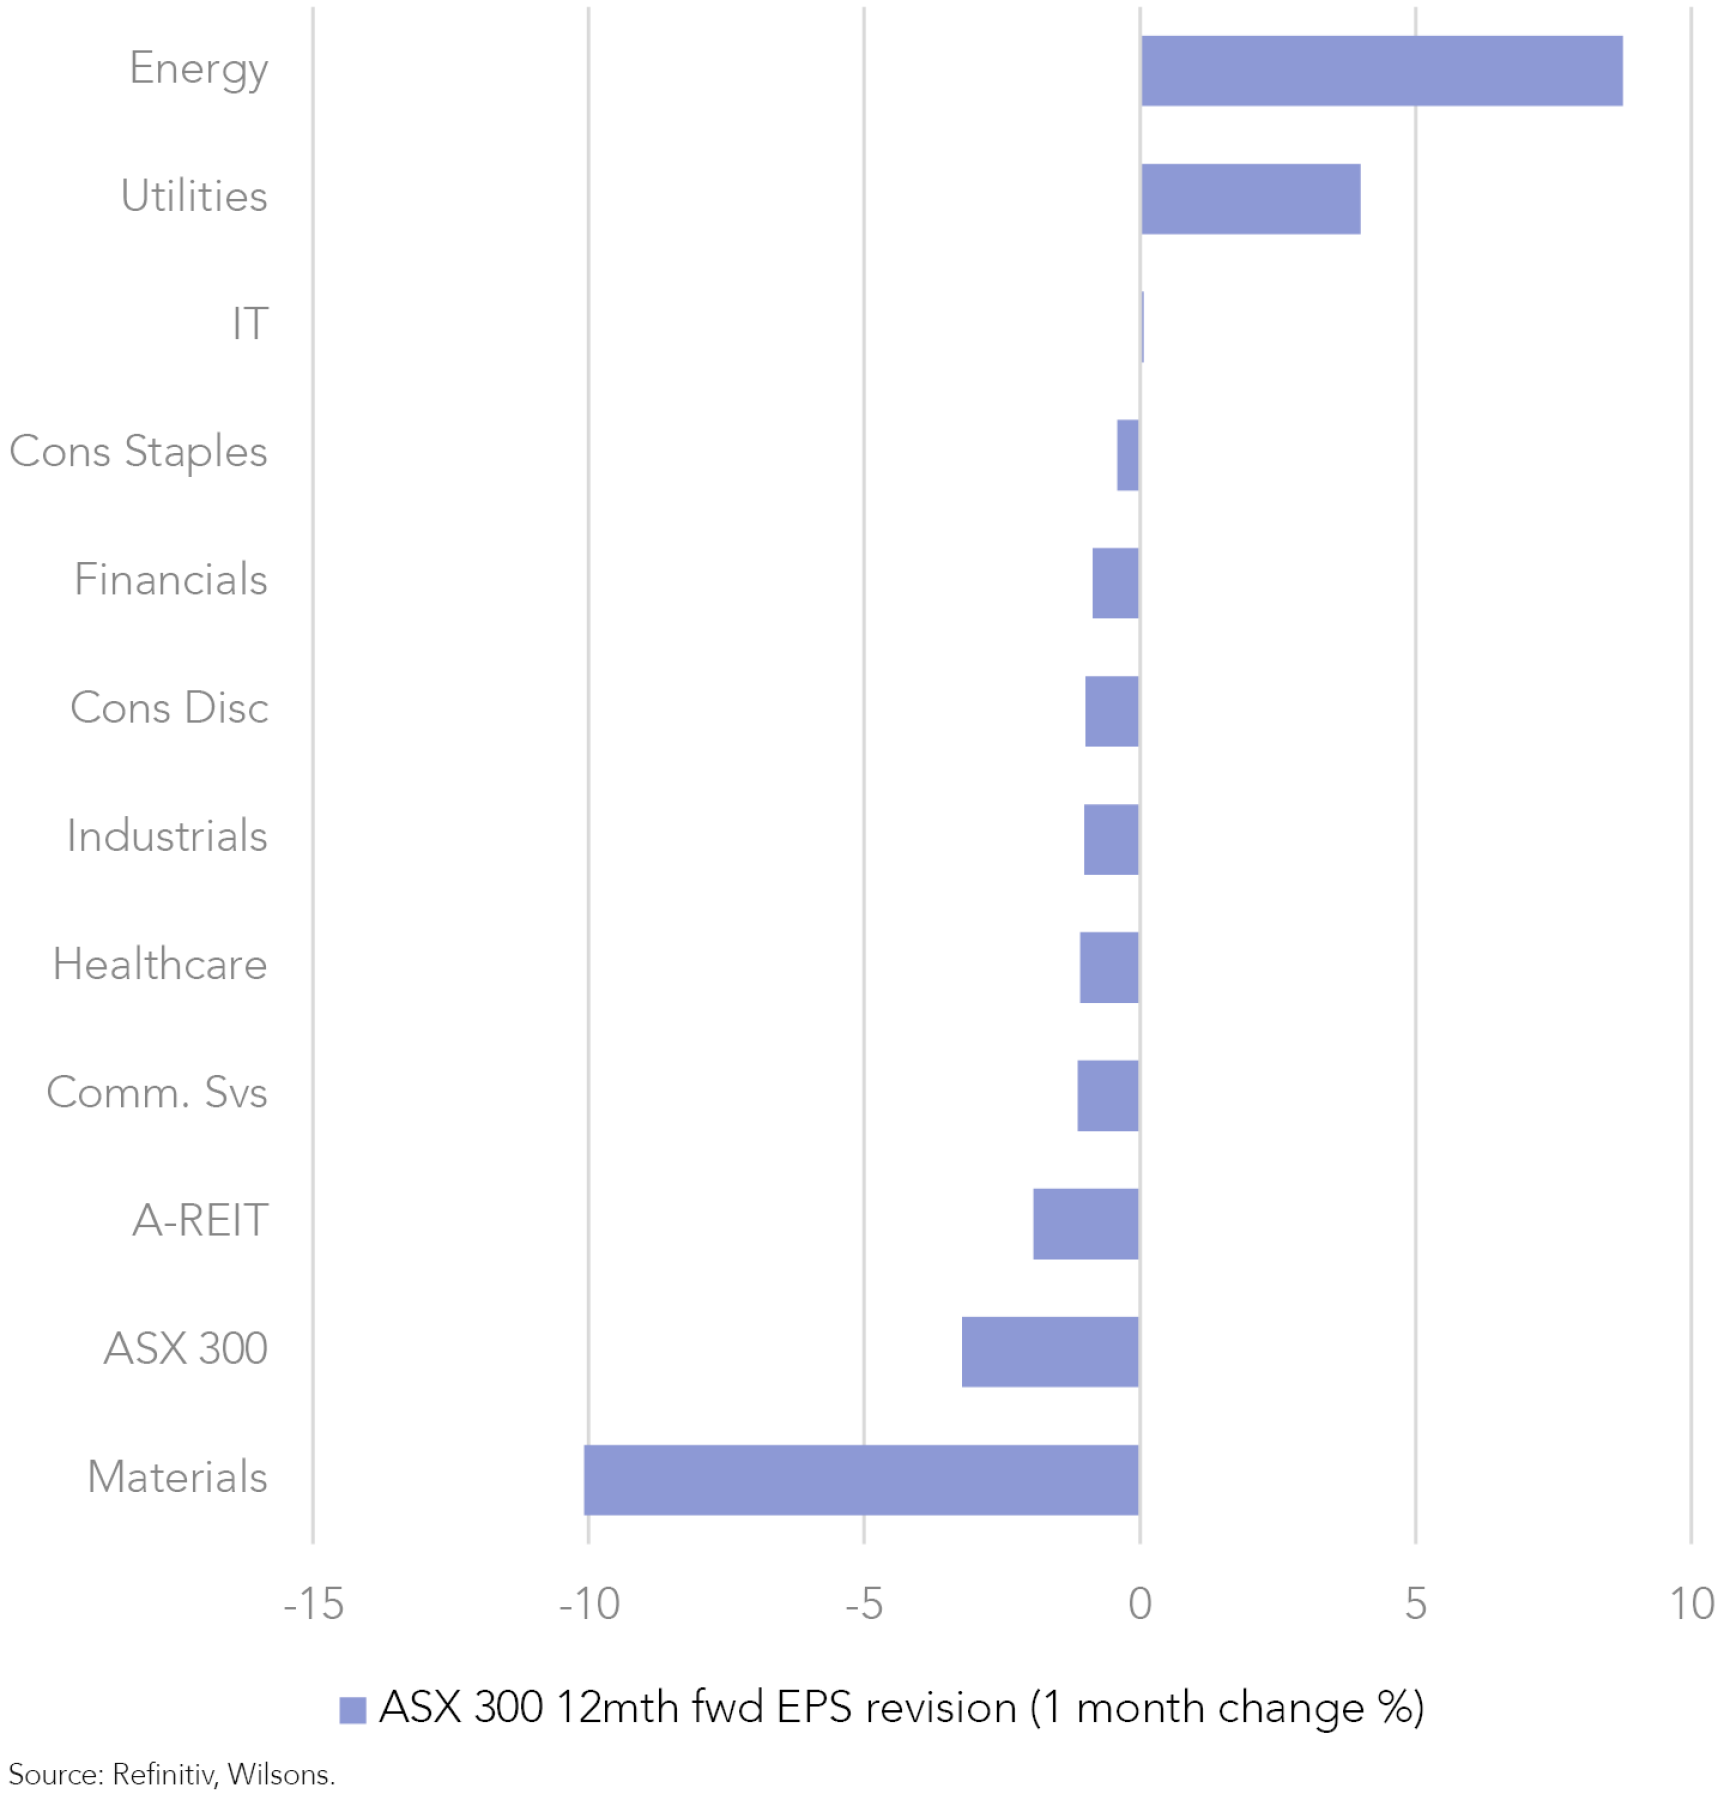
Resources were the worst performing sectors as commodity prices fell as recession fears increased concerns that demand for commodities would fall over the next 12 months, while the COVID situation in China continues to show no material signs of improvement.
From an individual stock perspective, the best performing ASX 100 stocks were Wisetech (WTC) (+32.4%), Pilbara Minerals (PLS) (+21.0%) and Xero (XRO) (+20.8%). The worst performers were Newcrest Mining (NCM) (-7.6%), Tabcorp (TAH) (-7.0%) and BHP Group Ltd (BHP) (-6.2%).
ISG views for August
Continue to add quality
We currently believe that quality is the best place for equity portfolios, within a backdrop of a slowing growth and heightened uncertainty.
Over the next year, we expect global economic growth and earnings growth to slow significantly. As a result, companies with high quality, resilient earnings streams should be increasingly sought after by the market.
To add more quality to the Focus List, we have added ResMed (RMD) at a 2.5% weighting.
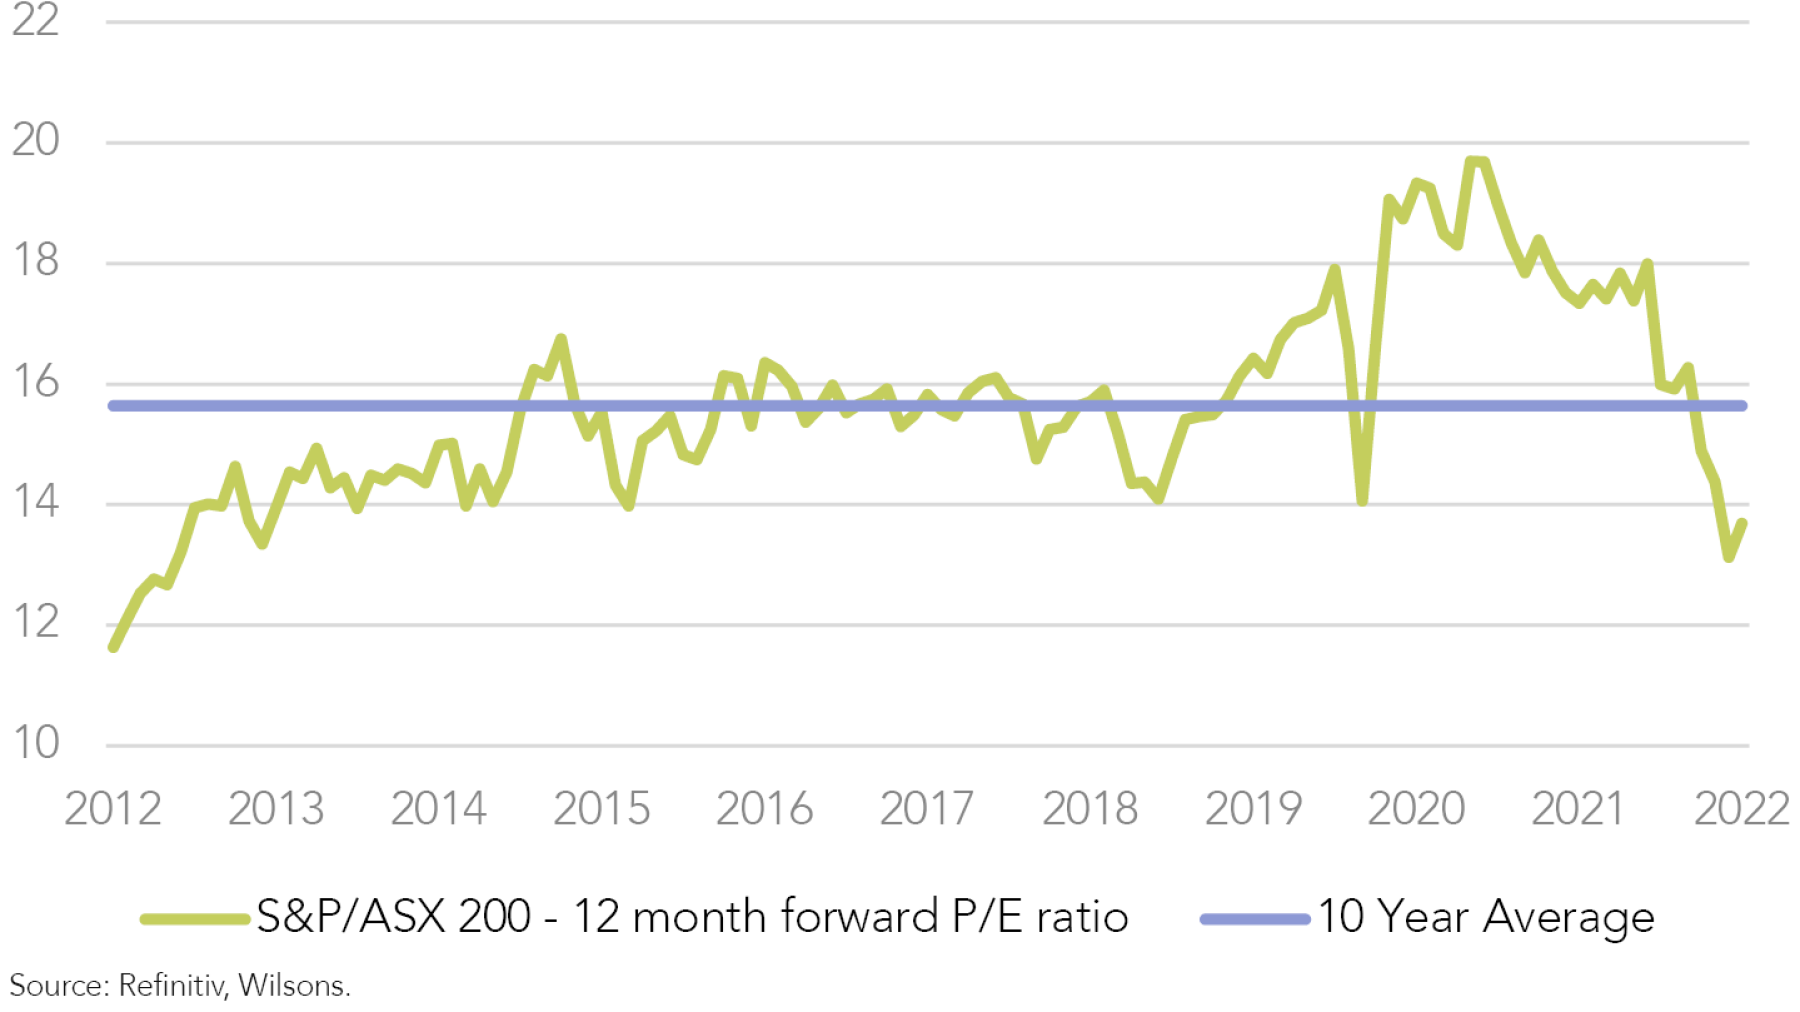
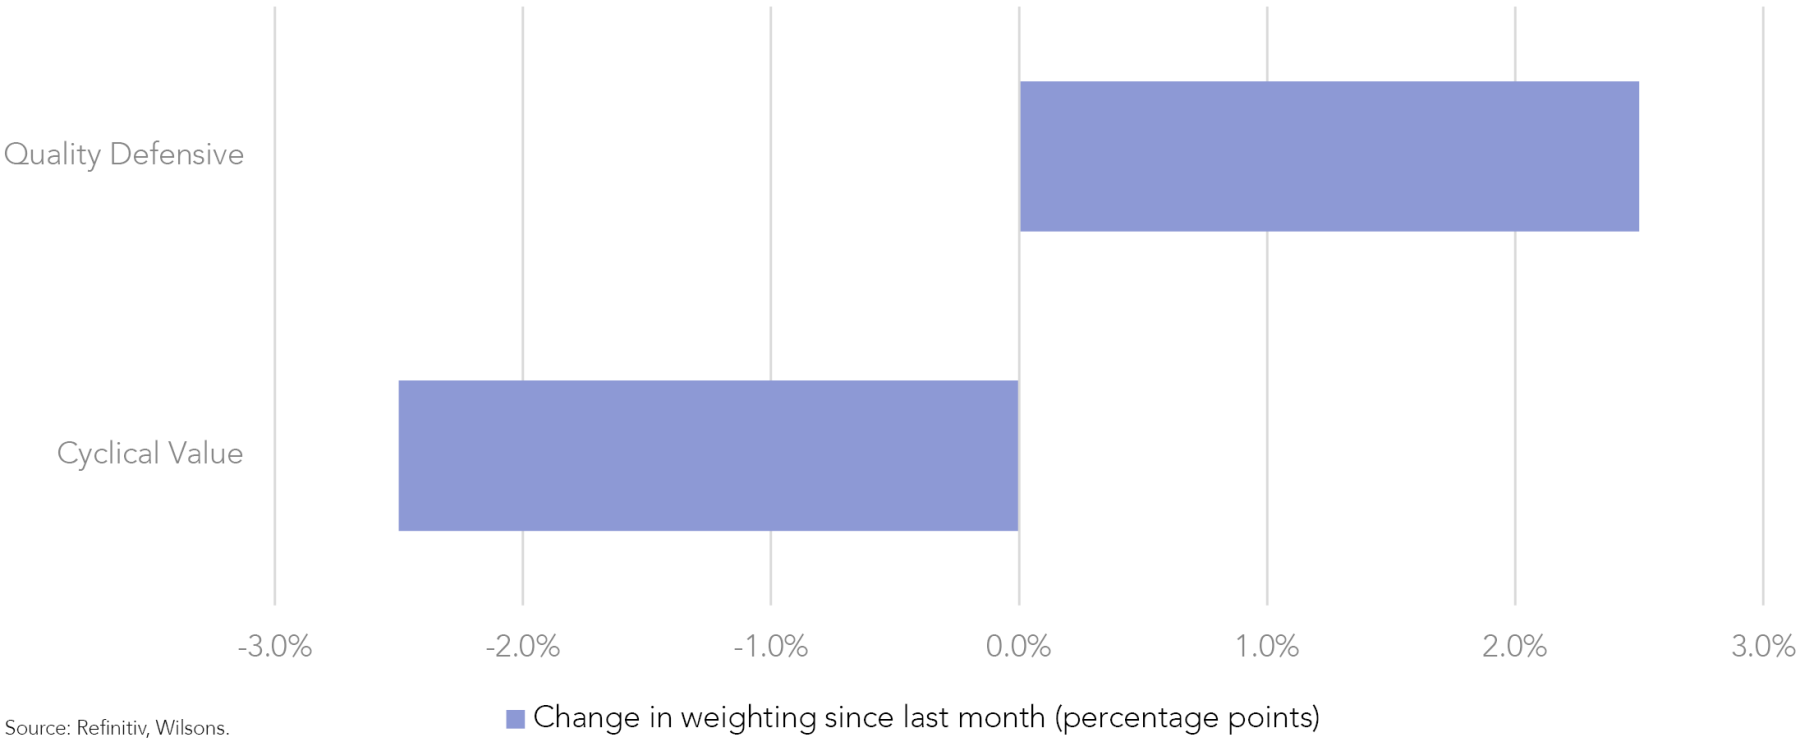
Valuations less in focus
In our view, the market has started to shift its focus away from valuations after a significant valuation reset over the first half of the year. As earnings become the focus of the second half of this year, we are continuing to shift our focus towards quality earnings.
With this in mind, we have also started to reduce our weighting to the more cyclical parts of the portfolio and removed Seven Group (SVW) (-2.5%). We have also trimmed Oz Minerals (OZL) by 1% after strong share price performance after knocking back BHP’s $25 a share indicative bid and used these proceeds to add to Allkem (AKE). It is worth noting, that we don’t think this will be the last bid from BHP and have kept OZL at a 2% weighting.
We don’t necessarily believe that these companies will have poor results but are more concerned about their outlooks. As the economy slows, cyclicals are most likely to see lower demand and earnings downgrades over the next 6 months, which we believe will lead to underperformance.
Reporting season kicking off
The Australian share market could be in for a mixed reporting season with respectable results tempered by cautious outlook statements, as threats to corporate profits accumulate at home and abroad. We are looking out for 3 key areas this reporting season:
Costs pressures bubbling: higher cost of materials, energy and labour are likely to impact FY22 earnings.
Spending slowdown: we think this is unlikely to hit the FY22 performance for the likes of JB Hi-Fi (JBH) or Harvey Norman (HVN), but we believe that forward guidance and trading updates may start to show a decline in sales or higher discounting for the post-FY period.
Dividend upside: dividends in certain sectors may be the key upside surprise for investors this reporting season. We believe this can be driven by 2 factors – elevated commodity prices and US dollar strength.
We preview the reporting season in more detail below.

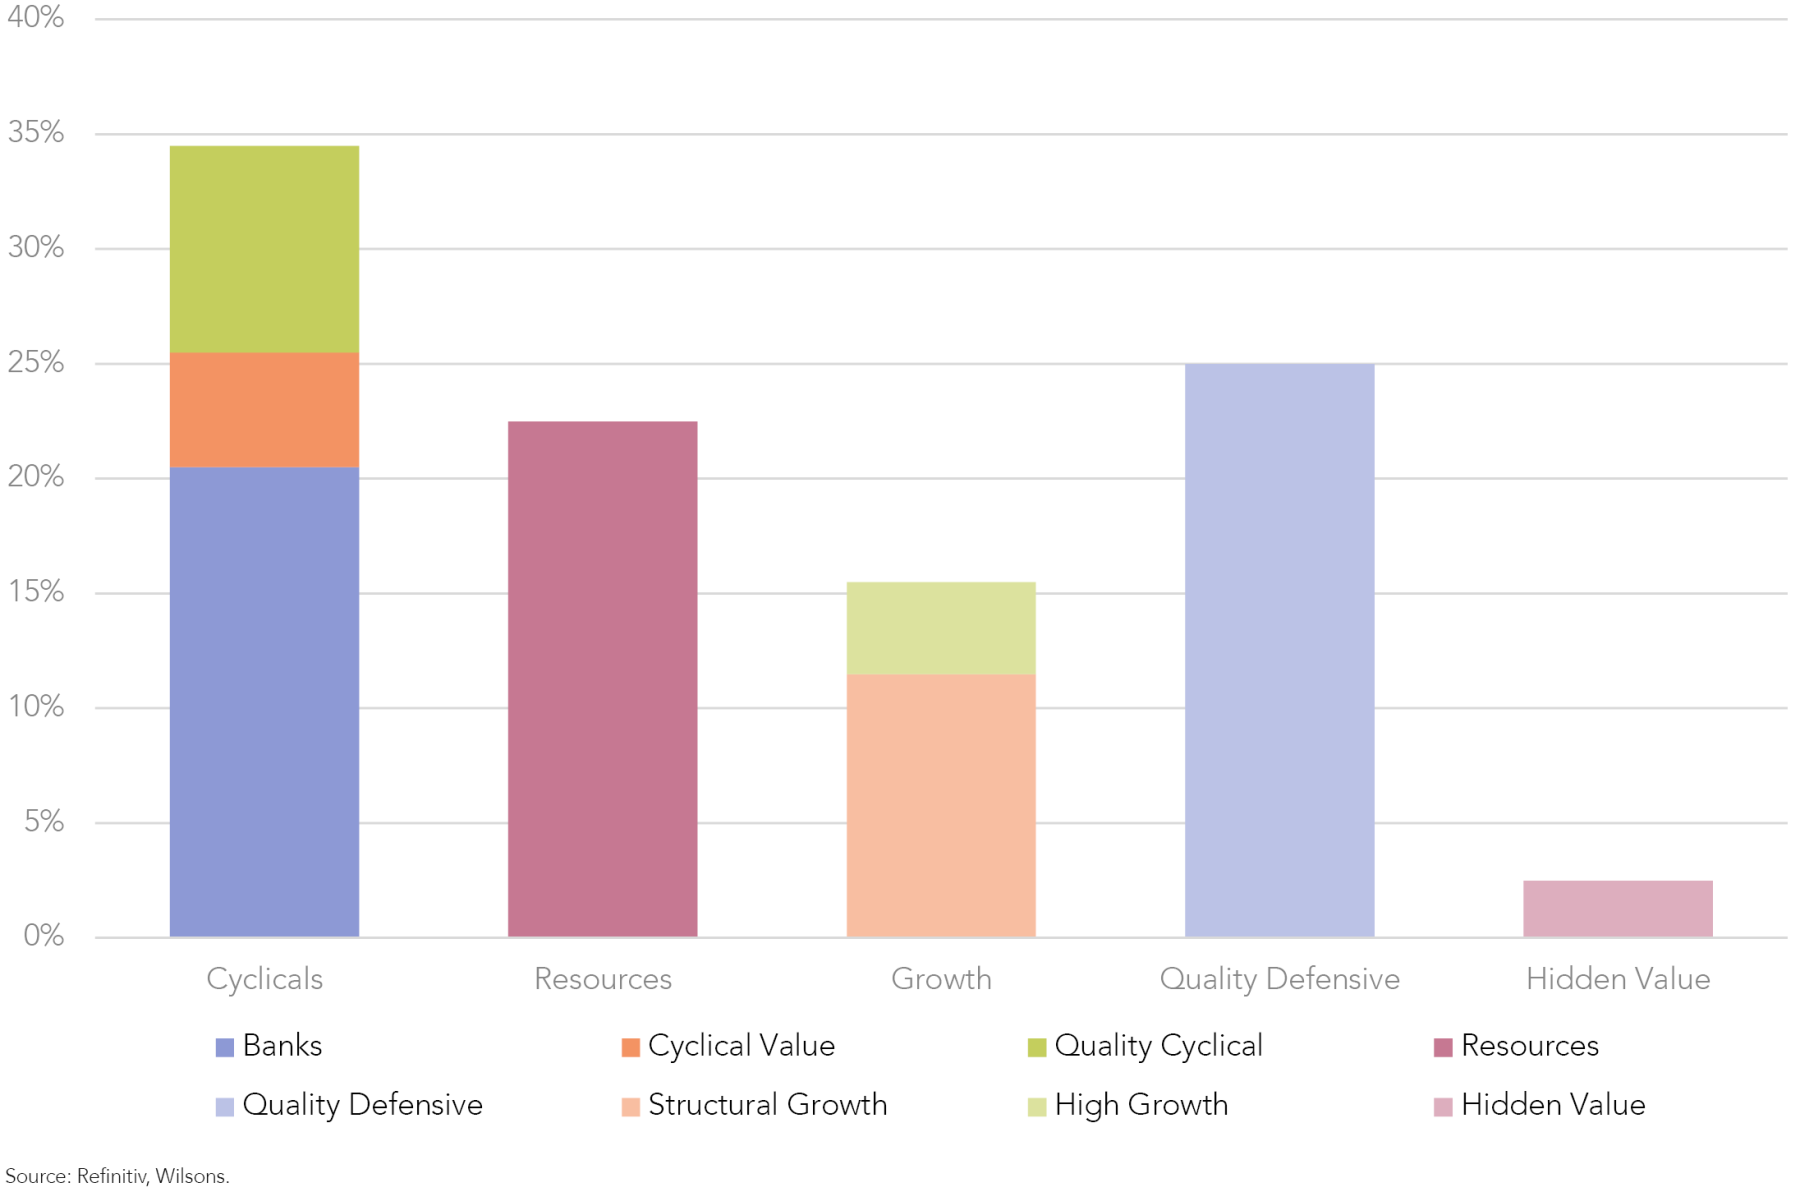
| Sectors | July Weighting | August Weighting | Market Weighting | Focus List Stocks | ISG View |
| Cyclical | |||||
| Resources | 22.50% | 22.50% | 24.10% | BHP, STO, WDS, OZL, NST, AKE | The Focus List is underweight resources at a headline level, but this is predominately due to our weighting in iron ore focused miners rather than our weighting to other sub-sectors. We like resources as an inflation hedge and protection against a longer than expected Russia/Ukraine conflict. We believe that there could be a sustained boom in miners associated with EV minerals. We have therefore overweight positions in copper and lithium via OZL and AKE respectively. We have recently trimmed our position in OZL after the bid from BHP this week. We like to take profits when we can, and this is a good opportunity to do just that. We still remain overweight in copper and OZL at a 2% weighting. We have taken these proceeds to add to AKE. We believe lithium should be more insulated from an economic slowdown than copper over the next 12 months. Focus List Overweight: Energy, Copper, EV minerals Neutral: Gold Underweight: Iron Ore |
| Banks | 20.50% | 20.50% | 20.30% | NAB, WBC, ANZ, JDO | The Focus List is neutral in the banks. In June we trimmed this slightly by reducing our holding in JDO. We believe that Net Interest Margins (NIM) of the major banks will grow faster than consensus forecasts, so we will keep our overweight. However, with the RBA increasing interest rates at such a lightening pace, we are concerned that loan growth could slow substantially. We trimmed JDO, the smallest bank in the Focus List, as we believe there may be more pain to come as it tries to build its book over the next few years – a recession or significant slowdown in the middle would likely be a headwind for earnings and the stock price. |
| Cyclical Value | 8% | 5.00% | 8.50% | QAN, TAH | Resources and Banks provide a large allocation to these sectors but we also hold QAN and TAH (as COVID recovery plays). While these stocks are cyclical, we believe that the market is mispricing the earnings potential of these companies. We removed SVW from the Focus List to remove some cyclicality. |
| Quality Cyclical | 9% | 9% | 8% | MQG, JHX | We believe these quality cyclicals will continue to generate high returns on capital at this point in the cycle, even though higher bond yields are putting pressure on valuations. MQG and JHX remain core holdings of the Focus List. While MQG and JHX will not be immune to an economic slowdown or a recession, we believe that these companies can cover their costs of capital at the bottom of the economic cycle, a characteristic we like when holding these stocks throughout the cycle. The earnings potential of both these stocks over the medium-term are potentially still underestimated by the market and both these stocks still look like good buying opportunities. |
| Growth | |||||
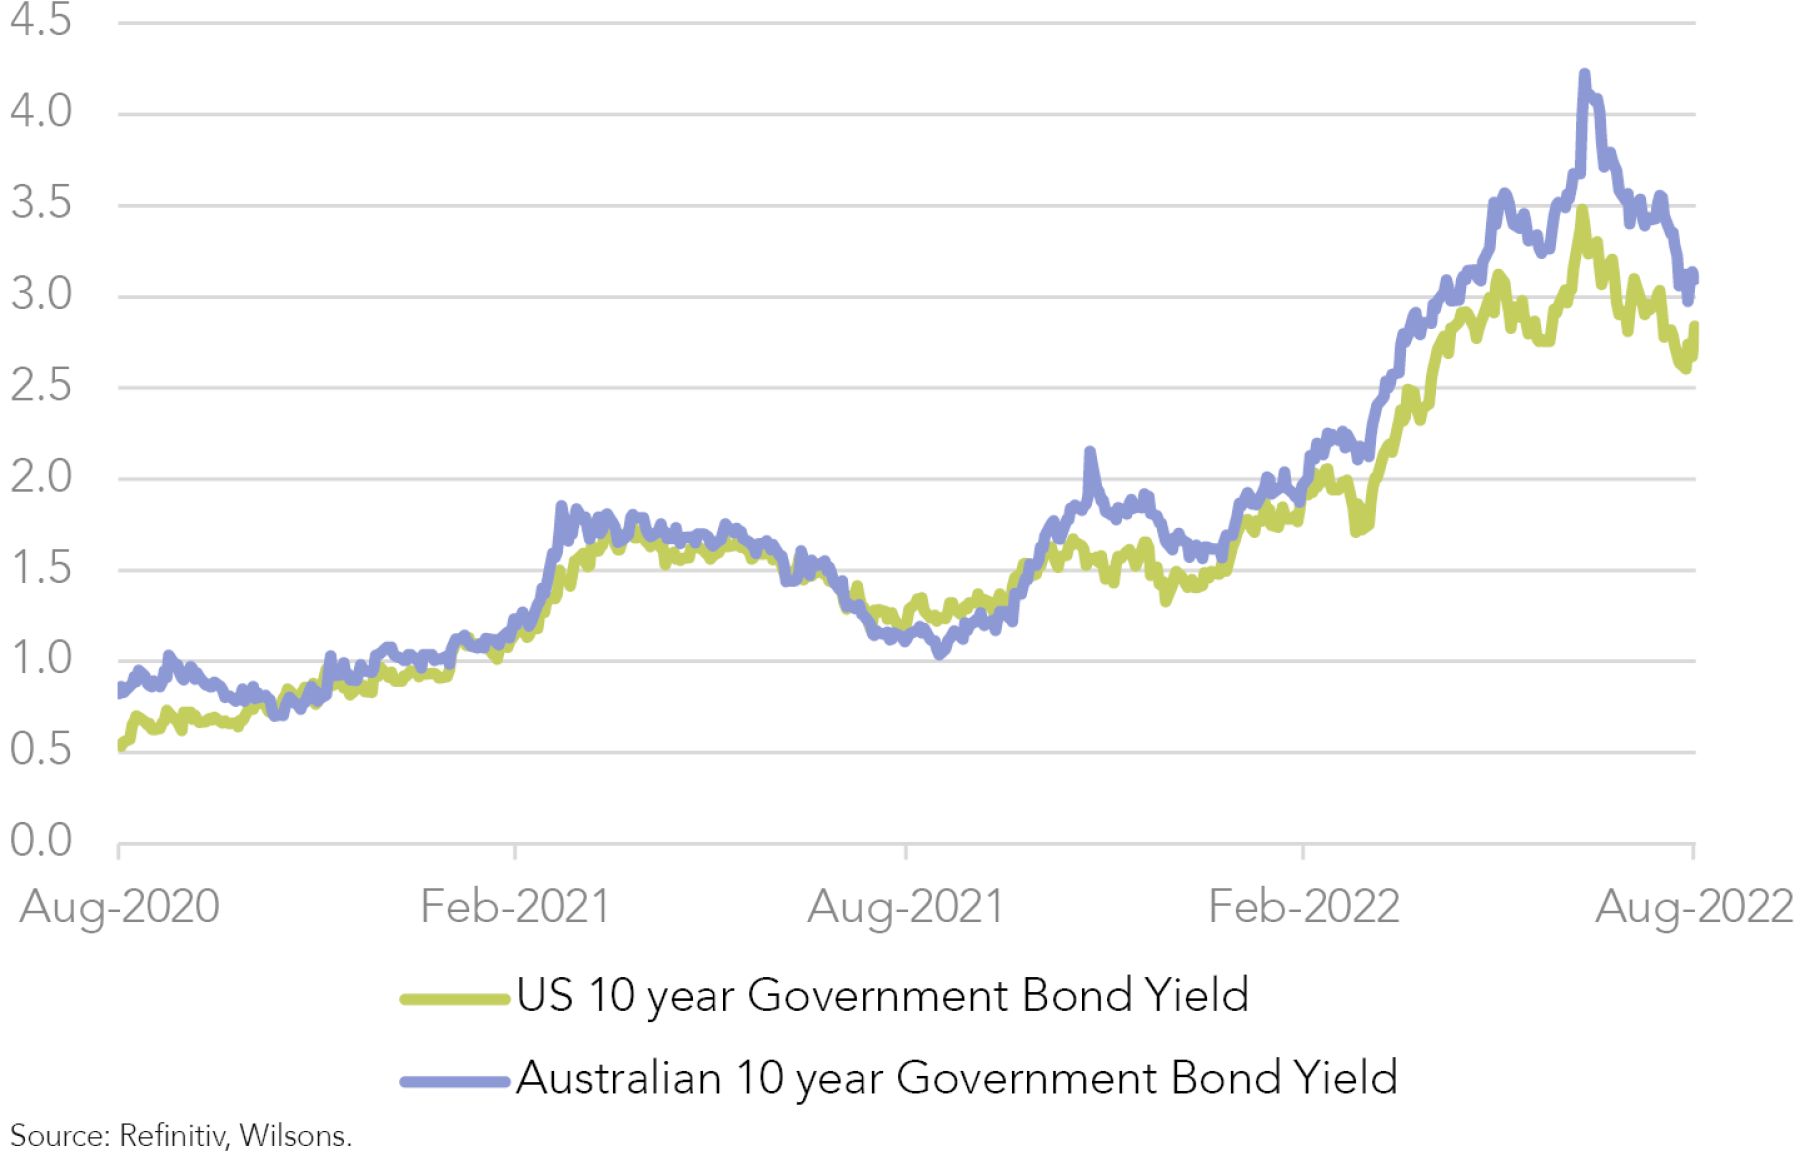
| Structural Growth | 11.50% | 11.50% | 8.20% | ALL, GMG, SEK, PNI | The Focus List has a structural bias towards quality growth. We still hold these stocks as we believe these stocks have a strong growth trajectory over the medium-term, but higher bond yields have heightened valuation pressure over the past 6 months. In our opinion, the growth stocks in the Focus List have been oversold over the past 6 months. US and Australian bond yields look to have peaked, while our preferred growth exposures have tangible earnings growth prospects. |
| High Growth | 4.00% | 4.00% | 2.20% | XRO, TLX | We are overweight in high-growth stocks. We are still reasonably cautious on high growth stocks due to valuations, but as we believe bond yields have likely peaked, these names could get a bid as they did in July. We believe XRO and TLX are the best picks from this factor. |
| Quality Defensive | 23% | 25% | 29% | CSL, IAG, TLS, HCW, TLC, CWY, RMD | We currently have a preference for quality defensives. In a mid-late cycle, we prefer companies we believe will be resilient to the downside risks that are more prevalent in this part of the cycle. Additionally, given the level of uncertainty and volatility that is persistent in markets at the moment, we believe holding names that are less sensitive to the economy and rising rates to be a prudent decision. Our picks are healthcare, lotteries, insurance and telcos. We added ResMed to add more quality defensives to the Focus List. |
| Hidden Value | |||||
| Hidden Value | 3% | 2.50% | N/A | NWS | We are always on the lookout for stocks with hidden value. We find this subset of the portfolio can provide above-market returns that are less correlated to the rest of the market. NWS should have catalysts to highlight value to the market over the next 12 months. |
*As of 08/08/22
Source: Refinitiv, Wilsons.
Increasing Exposure to Quality
Over the past few months, as we have progressed towards the later stages of the cycle, we have reduced the cyclicality of the Focus List and increased our exposure to high quality companies with defensive earnings growth profiles that are relatively insulated from the macroeconomic backdrop.
Considering all of these characteristics, we've added ResMed (RMD) to the Focus List.
Adding RMD to the Focus List (2.5%)
Quality characteristics
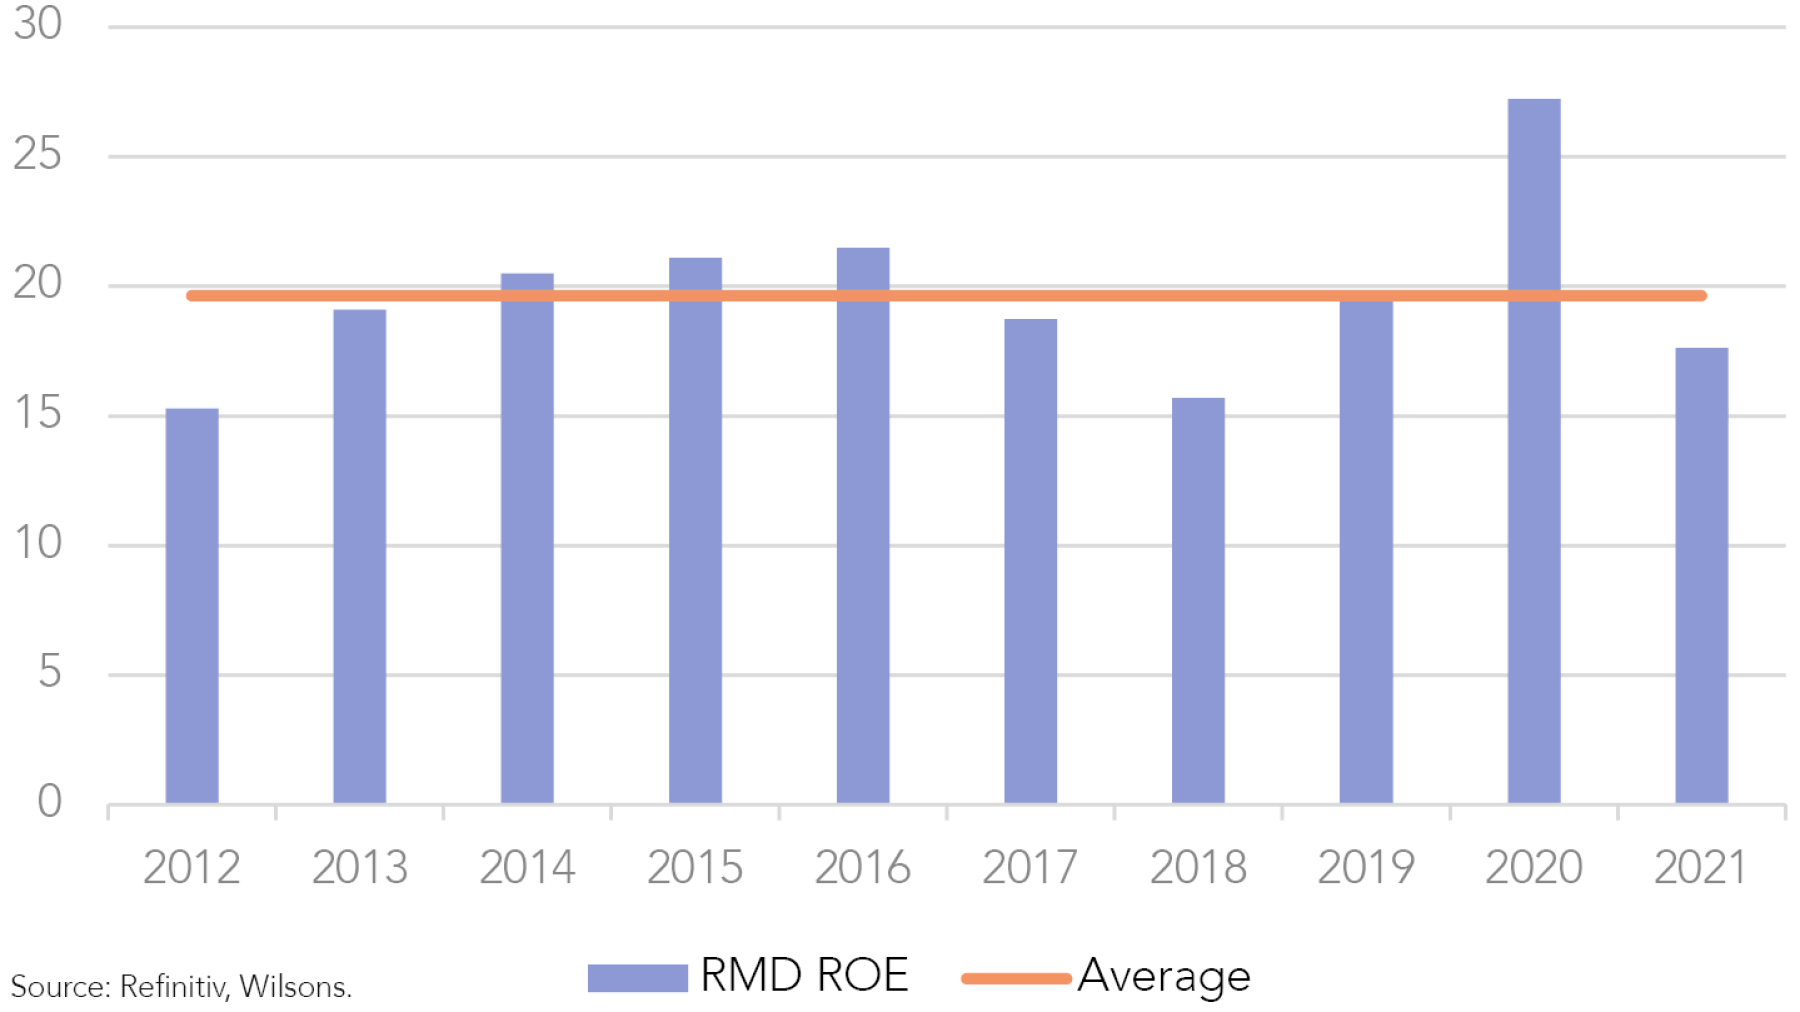
Looking at RMD through a ‘Quality’ lens, RMD has consistently generated a high return on invested capital (ROIC) and return on equity (ROE). Over the past 10 years, the business has delivered an impressive average ROIC and ROE of 15% and 20%, respectively.
We are also attracted to RMD’s dominant position in the global continuous positive air pressure device (CPAP) market, which reflects the perceived superiority of its offering and a history of strong capital management.
Recent analysis from Wilsons’ healthcare analysts estimates that RMD will achieve a market share of ~69% and ~56% in the US and in the rest of the world (ROW), respectively, in FY22.
‘Through-the-cycle’ demand profile
RMD is an inherently defensive business, with the treatment of medically diagnosed breathing conditions being essential and therefore non-discretionary. CPAP therapy is reimbursed by private and public payers in most major markets, making it affordable for most patients.
We also believe the customer base is sticky. After purchasing a CPAP device – a relatively high value and infrequent purchase decision – customers are unlikely to regularly move between providers without significant quality concerns (e.g. Phillips). RMD’s Software as a Service (SaaS) offering also helps to ‘lock in’ customers, which provides recurring revenues, as does the ongoing sale of masks and accessories (while also being high margin).
Under-penetration in the CPAP market
Wilsons' analysts estimate the sleep apnea device market is significantly under-penetrated. Industry level penetration of the market is estimated at <20% in the US, and <5-10% in Europe and other ROW markets, leaving a long runway for growth across the industry. This under-penetration drives typical organic ‘system growth' of 6-8% p.a., which is structurally above healthcare at 2-3% p.a. Enhanced awareness and diagnosis should support a continuation of consistent above-industry growth in the new patient population over the medium to long-term.
Phillips recall provides a significant opportunity
RMD’s major competitor, Phillips, first announced a recall of its CPAP devices in July 2021, which has presented a significant opportunity for RMD to take material and lasting market share.
In Philips’ most recent result in 2Q22, the company cited ongoing delays and the potential for increased regulatory oversight. Philips plans to attain 2019 sales levels by 2025, inferring a much slower recovery than previously expected. The delay provides RMD with an additional opportunity to grab a larger market share that the business was previously unable to capture.
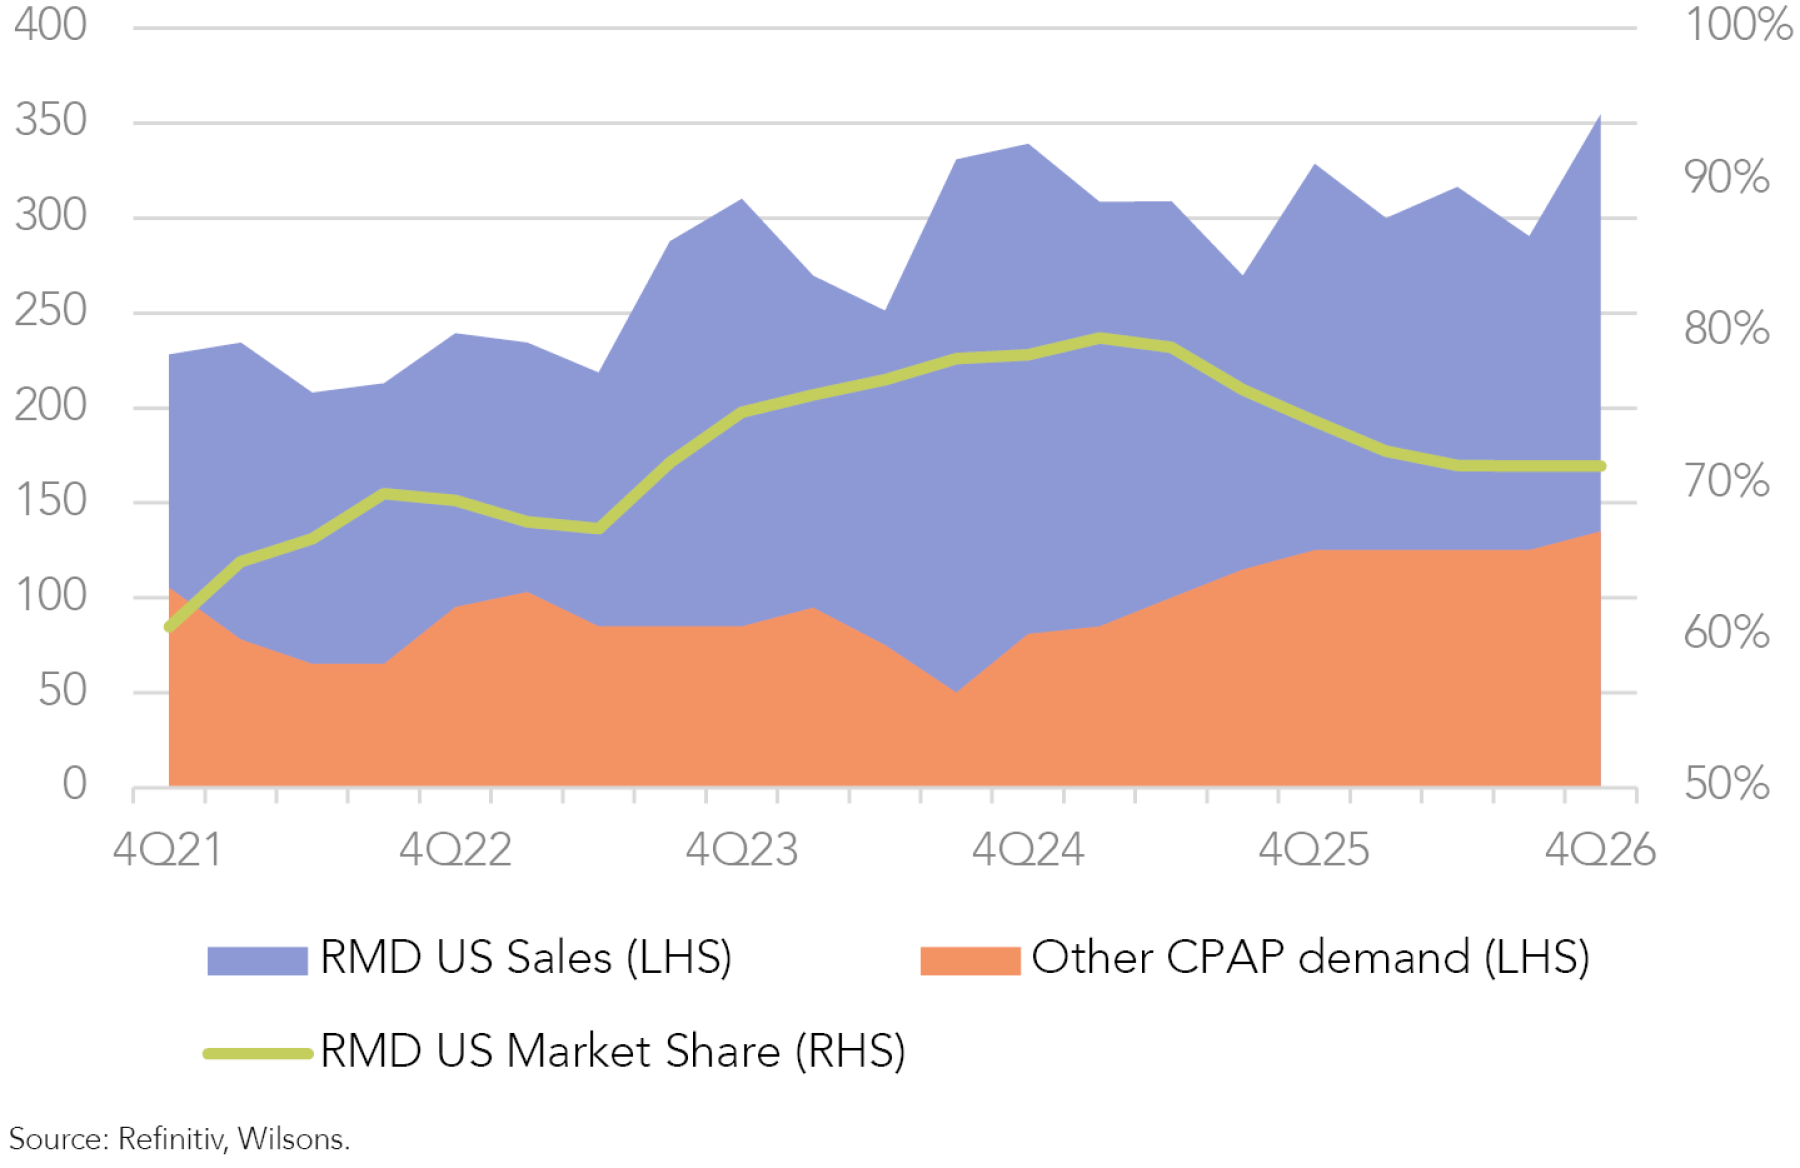
Wilsons’ analysts* assess a US$600m under-contested supply opportunity for RMD in FY23e in the CPAP category and forecast that RMD’s theoretical share of the market could peak in FY24e at ~79% in the US and at ~58% in ROW (relative to the current 69% and 56%, respectively). We believe Phillips’ shortcomings could have a persistent long-term impact on customer preferences in the CPAP market.
*Where can ResMed take share in FY23?
Risks largely mitigated
- Chip shortages
RMD has been hampered by global supply chain constraints (such as chip shortages), which has prevented the company from fulfilling the demand left by Philips. RMD's management responded by providing customers with chip-independent CPAP devices as an interim solution (the card-to-cloud AS10). When component shortages ease, AS11 devices will be available, allowing the business to address underserved populations. - Cost inflation
RMD has experienced rising input costs consistent with the supply-constrained industry backdrop. However, the business has managed to pass through price increases, and demand has remained resilient. Phillips' absence from the market has strengthened the company's high level of pricing power.
Valuation
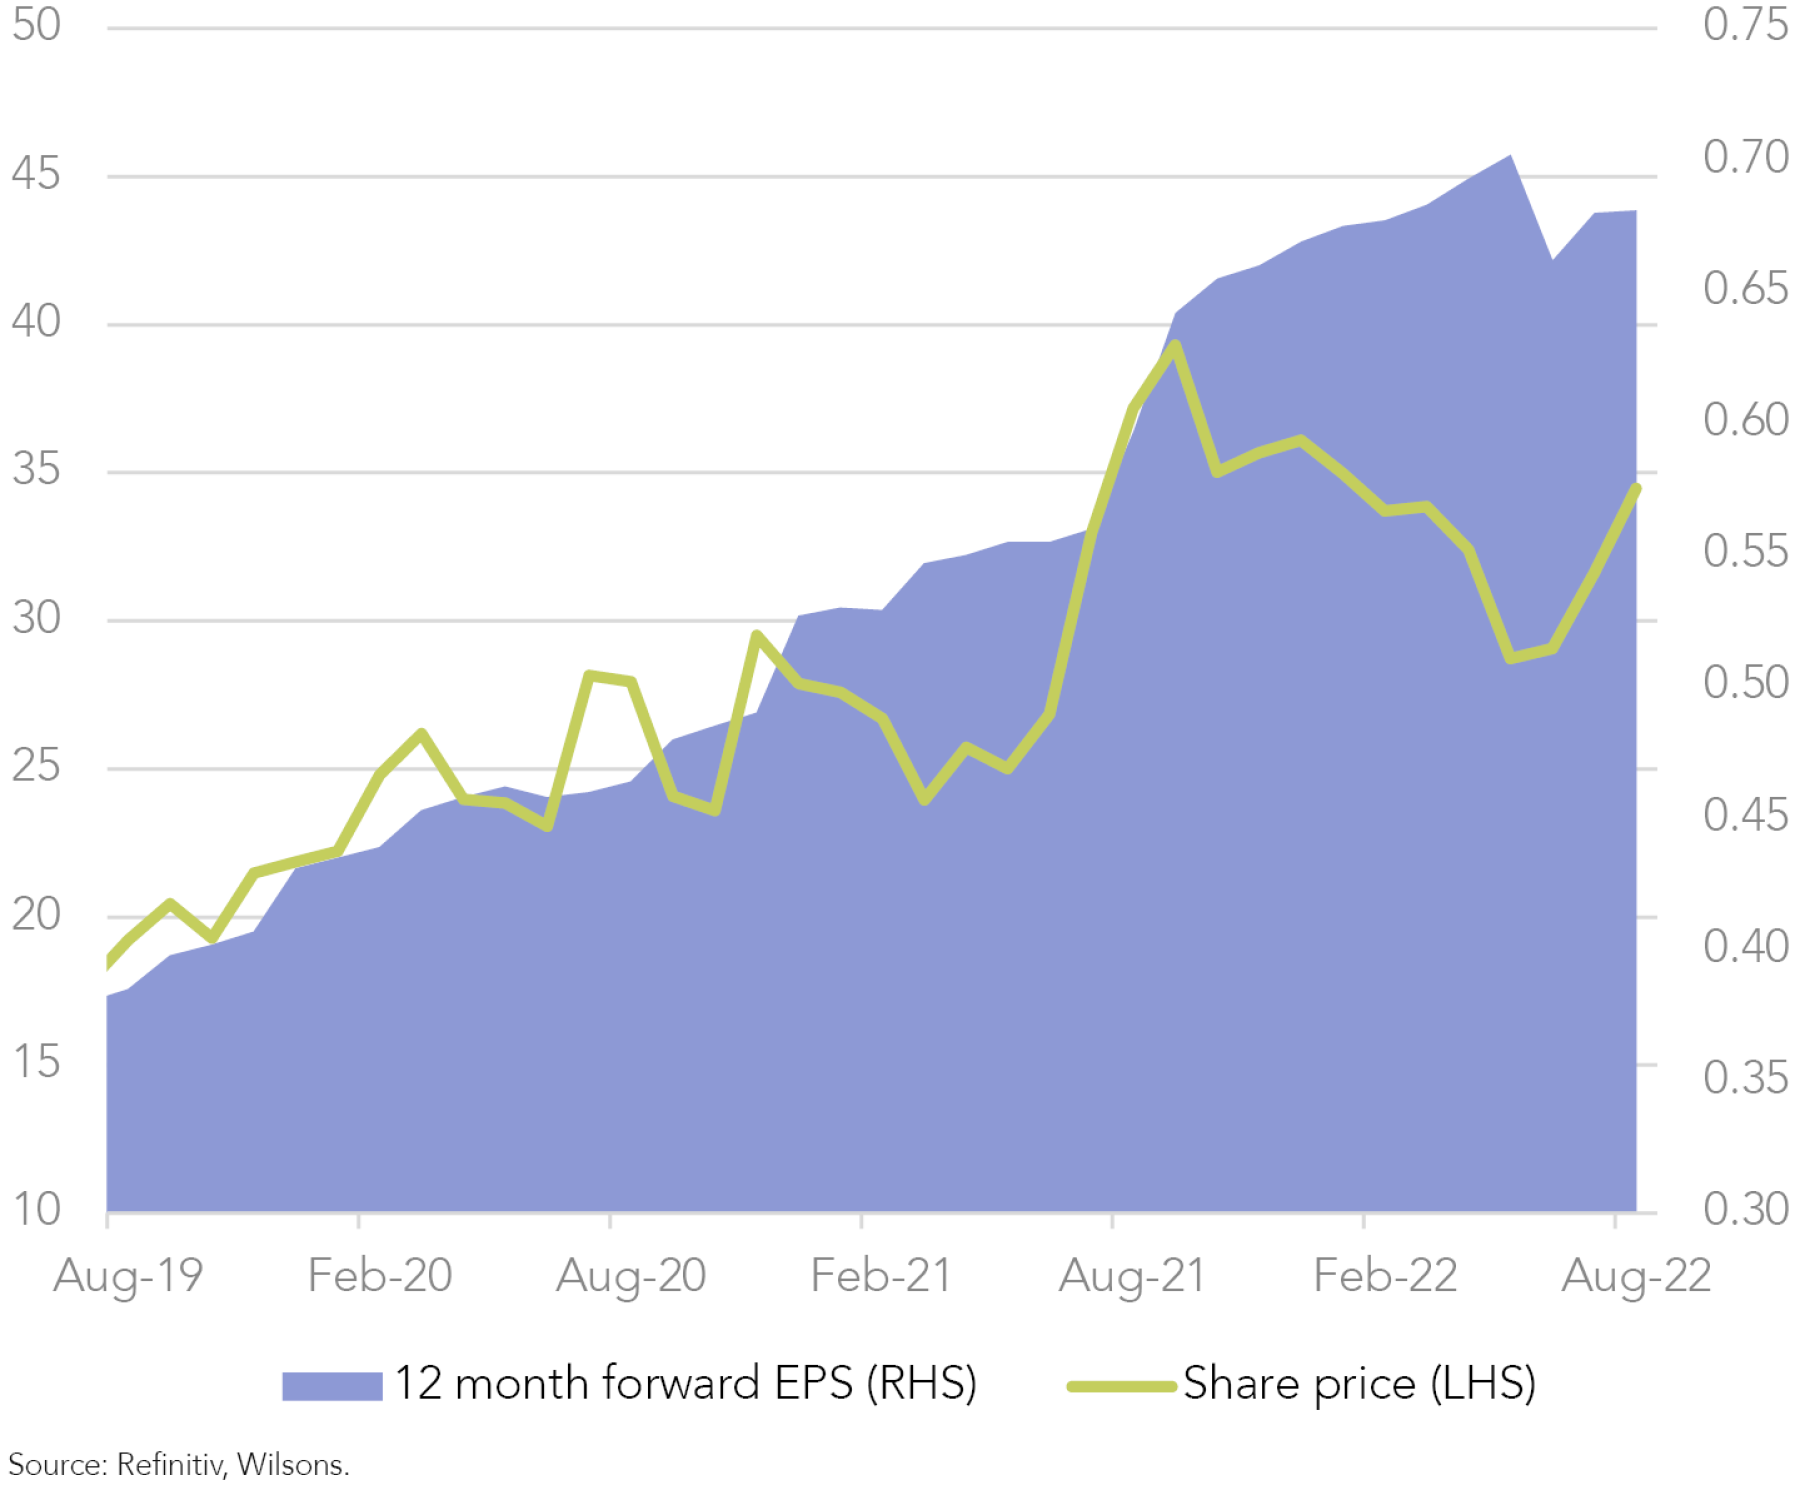
RMD trades at a 12-month forward PE ratio of ~37x, broadly in line with its trailing 3-year average. We view this as an attractive valuation considering both the long-term runway for growth in the under-penetrated CPAP market and the medium-term opportunity for RMD to strengthen its market position while Phillips is sidelined.
The consensus of sell-side forecasts currently points to an above-market EPS CAGR of ~12% to FY24. However, we see potential upside to FY23/FY24 estimates given the recent changes in the competitive landscape. Wilsons analysts* estimate that RMD will deliver EPS of US$1.49 per share in FY22, above consensus forecasts of US$1.45. RMD is scheduled to report on 12 August.
*Where can ResMed take share in FY23?
Other Changes to the Focus List
Removing Seven Group (SVW) (-2.5%)
Under these more challenging circumstances for the global economy, cyclicals are most likely to see lower demand and earnings downgrades over the next 6 months, which we believe will lead to underperformance.
SVW has been a core member of the Focus List since inception on the premise that Coates and WesTrac are more defensive than the market is crediting, which should lead to a rerating. Since Boral Limited (BLD) was acquired in 2021, we believe the company has become more cyclical and is, therefore, a good source of reducing portfolio cyclicality.
Over the next 12 months, we believe the reduction in government stimulus, especially in infrastructure, will likely hurt earnings.
Trimming OZ Minerals (OZL) -1.0%
We have trimmed our position in OZL by 1% to crystalize some gains following share price strength earlier this week after a takeover bid from BHP. We think it is an opportune time to take some risk off the table as the near-term outlook for the copper price has deteriorated since the beginning of the year amidst a slowing economic backdrop.
Adding to Allkem (AKE) +1.0%
We are redeploying the proceeds from OZL back into the green commodities/EV metals space by increasing our overweight exposure to AKE. We remain favourable towards lithium over the medium-term. The metal is forecast to be in a structural deficit over the next decade due to the rapid transition towards Electric Vehicles. We also view lithium as less cyclical than copper, which is still a popular industrial metal. Realized lithium prices have held up well this year, while other industrial metals (like copper) have recently softened.
| Company Name | Ticker | Weighting | Beta | Share Price | Market Cap (A$b) |
Forecast Multiples | EPS | EPS | EPS | EPS CAGR % | Dividend Yield % | ROE | Net Debt/EBITDA | Consensus Recommendation Mean (5 = Strong Sell, 1 = Strong Buy) |
|
| 12mth fwd PE | 12mth fwd EV/EBITDA | FY1 | FY2 | FY3 | (FY1-FY3) | 12mth fwd | (FY1) | (FY1) | |||||||
| Communication Services | |||||||||||||||
| News Corp | NWS | 2.50% | 1.15 | 24.27 | 14.6 | 17 | 6.9 | 97% | 113% | 150% | 25% | 1% | 7% | 0.3 | 2.1 |
| Seek | SEK | 2.50% | 1.48 | 23.03 | 8.1 | 31.6 | 17.2 | 71% | 71% | 80% | 6% | 2% | 14% | 2.1 | 2.5 |
| Telstra | TLS | 3.00% | 0.62 | 4 | 45.7 | 23.6 | 7.8 | 14% | 17% | 18% | 15% | 4% | 11% | 1.6 | 2.2 |
| Consumer Discretionary | |||||||||||||||
| Aristocrat Leisure | ALL | 4.00% | 1.26 | 34.06 | 22.4 | 18.4 | 11.1 | 168% | 187% | 205% | 10% | 2% | 23% | -0.4 | 2.1 |
| Lottery Corporation | TLC | 3.00% | 1 | 4.5 | 9.9 | 26 | 13 | 16% | 17% | 18% | 6% | 3% | 267% | 3.1 | 2.4 |
| Tabcorp Holdings | TAH | 1.00% | 1.17 | 0.97 | 2.1 | 24.8 | 10 | 2% | 4% | 4% | 49% | 3% | 5% | 0.4 | 2.8 |
| Energy | |||||||||||||||
| Santos | STO | 4.00% | 1.92 | 7.05 | 23.4 | 6.6 | 3.7 | 81% | 71% | 57% | -16% | 6% | 19% | 0.5 | 1.9 |
| Woodside Energy Group | WDS | 3.00% | 1.24 | 31.75 | 59.6 | 7.4 | 4.3 | 330% | 283% | 234% | -16% | 9% | 22% | 0.3 | 2.1 |
| Financials | |||||||||||||||
| ANZ | ANZ | 5.00% | 1.16 | 22.91 | 69.8 | 10.5 | 212% | 218% | 231% | 4% | 7% | 10% | 2.5 | ||
| IAG | IAG | 3.00% | 0.32 | 4.56 | 11.1 | 14.3 | 10.2 | 11% | 32% | 34% | 76% | 6% | 5% | 2.3 | |
| Judo Capital Holdings | JDO | 1.00% | 0.77 | 1.25 | 1.4 | 19.9 | 32.5 | 1% | 6% | 10% | 230% | 0% | 1% | 1.8 | |
| Macquarie Group | MQG | 6.00% | 1.47 | 176.62 | 68.2 | 16.3 | 26.1 | 1062% | 1113% | 1157% | 4% | 4% | 14% | 2.4 | |
| NAB | NAB | 8.50% | 1.25 | 30.71 | 96.4 | 13.1 | 214% | 237% | 249% | 8% | 5% | 12% | 2.5 | ||
| Pinnacle Investment Management Group | PNI | 1.00% | 2.19 | 10.76 | 2.1 | 25.8 | 23.6 | 40% | 49% | 57% | 19% | 3% | 20% | 0.6 | 2.5 |
| Westpac | WBC | 6.00% | 1.12 | 22.07 | 76.4 | 11.9 | 152% | 188% | 209% | 17% | 6% | 8% | 2.6 | ||
| Healthcare | |||||||||||||||
| CSL | CSL | 8.50% | 0.45 | 295.64 | 142.4 | 34.4 | 21.2 | 489% | 576% | 685% | 18% | 1% | 20% | 2.3 | 2 |
| ResMed | RMD | 2.50% | 0.26 | 34.57 | 50.1 | 34.5 | 24.6 | 57% | 68% | 76% | 15% | 1% | 26% | 0.3 | 2.2 |
| Telix Pharmaceuticals | TLX | 2.00% | 2.3 | 7.95 | 2.5 | 615.6 | -13% | 2% | 22% | 0% | -65% | 3.5 | 1.6 | ||
| Industrials | |||||||||||||||
| Cleanaway Waste Management Ltd | CWY | 3.00% | 1.28 | 2.68 | 5.5 | 28.6 | 10.6 | 7% | 9% | 11% | 23% | 2% | 6% | 2.7 | 2.4 |
| Qantas Airways | QAN | 4.00% | 1.38 | 4.56 | 8.5 | 12.5 | 4.6 | -69% | 31% | 64% | 2% | 2.2 | |||
| Information Technology | |||||||||||||||
| Xero | XRO | 2.00% | 1.31 | 94 | 14.1 | 192.3 | 45.1 | 40% | 77% | 138% | 86% | 0% | 6% | -0.5 | 2.3 |
| Materials | |||||||||||||||
| Allkem | AKE | 3.00% | 1.84 | 12 | 7.6 | 8.5 | 4.8 | 50% | 98% | 99% | 41% | 0% | 17% | -0.5 | 2 |
| BHP Group | BHP | 8.00% | 0.85 | 39.12 | 195.8 | 8.6 | 4.5 | 403% | 329% | 263% | -19% | 8% | 42% | 0.1 | 2.4 |
| James Hardie | JHX | 3.00% | 1.55 | 35.46 | 15.6 | 14.4 | 9.6 | 170% | 175% | 189% | 6% | 4% | 46% | 0.6 | 1.9 |
| Northern Star Resources | NST | 2.50% | 0.9 | 8.22 | 9.5 | 20.3 | 5.5 | 27% | 39% | 49% | 36% | 3% | 4% | -0.1 | 1.7 |
| OZ Minerals | OZL | 2.00% | 1.31 | 25.59 | 8.5 | 23 | 9.9 | 96% | 119% | 123% | 13% | 1% | 9% | 0.6 | 2.4 |
| Real Estate | |||||||||||||||
| Goodman Group | GMG | 4.00% | 1.01 | 20.13 | 37.2 | 21.4 | 20.2 | 81% | 93% | 102% | 12% | 2% | 11% | 0.8 | 1.9 |
| Healthco Healthcare and Wellness REIT | HCW | 2.00% | 0.8 | 1.65 | 0.5 | 20.7 | 14.4 | 5% | 8% | 9% | 33% | 5% | 4% | 4.5 | 2.3 |
Source: Refinitiv, Wilsons.

Written by
David Cassidy, Head of Investment Strategy
David is one of Australia’s leading investment strategists.
About Wilsons Advisory: Wilsons Advisory is a financial advisory firm focused on delivering strategic and investment advice for people with ambition – whether they be a private investor, corporate, fund manager or global institution. Its client-first, whole of firm approach allows Wilsons Advisory to partner with clients for the long-term and provide the wide range of financial and advisory services they may require throughout their financial future. Wilsons Advisory is staff-owned and has offices across Australia.
Disclaimer: This communication has been prepared by Wilsons Advisory and Stockbroking Limited (ACN 010 529 665; AFSL 238375) and/or Wilsons Corporate Finance Limited (ACN 057 547 323; AFSL 238383) (collectively “Wilsons Advisory”). It is being supplied to you solely for your information and no action should be taken on the basis of or in reliance on this communication. To the extent that any information prepared by Wilsons Advisory contains a financial product advice, it is general advice only and has been prepared by Wilsons Advisory without reference to your objectives, financial situation or needs. You should consider the appropriateness of the advice in light of your own objectives, financial situation and needs before following or relying on the advice. You should also obtain a copy of, and consider, any relevant disclosure document before making any decision to acquire or dispose of a financial product. Wilsons Advisory's Financial Services Guide is available at wilsonsadvisory.com.au/disclosures.
All investments carry risk. Different investment strategies can carry different levels of risk, depending on the assets that make up that strategy. The value of investments and the level of returns will vary. Future returns may differ from past returns and past performance is not a reliable guide to future performance. On that basis, any advice should not be relied on to make any investment decisions without first consulting with your financial adviser. If you do not currently have an adviser, please contact us and we would be happy to connect you with a Wilsons Advisory representative.
To the extent that any specific documents or products are referred to, please also ensure that you obtain the relevant disclosure documents such as Product Disclosure Statement(s), Prospectus(es) and Investment Program(s) before considering any related investments.
Wilsons Advisory and their associates may have received and may continue to receive fees from any company or companies referred to in this communication (the “Companies”) in relation to corporate advisory, underwriting or other professional investment services. Please see relevant Wilsons Advisory disclosures at www.wilsonsadvisory.com.au/disclosures.