
Since the RBA’s first rate cut in February, small caps (Small Ords) have outperformed large and mid caps (ASX 100), yet still trade at a significant discount. This suggests further opportunity for outperformance.
Since the start of the RBA easing cycle on February 18, the Small Ords (ASX 300 ex 100) has returned 14.3%, outpacing the ASX 100’s return of 5.8%.
This has been driven by improved earnings growth sentiment due to rate cuts, along with the subsequent rotation into small caps from underweight institutional investors and relatively better earnings results than larger peers.
The relatively strong earnings results from small caps in the recent August reporting season suggest that improving macro conditions are beginning to flow through to earnings and management outlook statements, with consumer companies faring particularly well.
This backdrop creates an encouraging set-up, making it timely to consider the broader case for small caps, why current outperformance can continue, and two key opportunities.
The Case for Small Caps – Less Concentration and Less Scrutinised
Less concentration and more exposure to attractive sectors
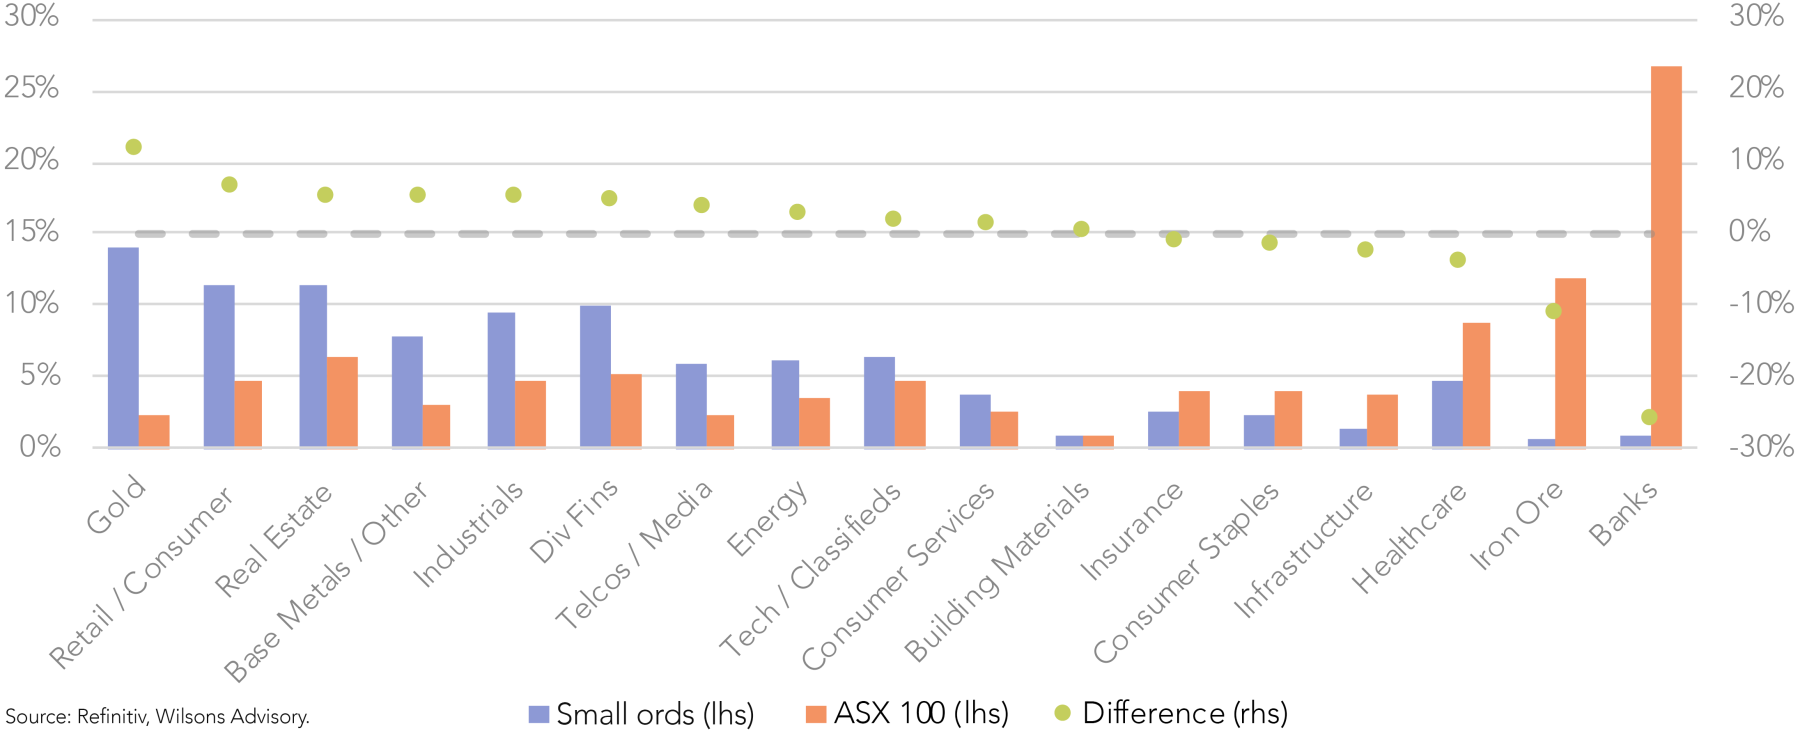
Compared to the ASX 100, the Small Ords index is far less concentrated and is less tilted towards growth-challenged sectors such as banks and iron ore.
While just the banks and iron ore comprise ~38.5% of the ASX 100, these low growth sectors account for just ~1.5% of the Small Ords, as seen in Figure 1.
This is a material drag on ASX 100’s EPS growth, as these two sectors have a median FY25-28 EPS CAGR of just 2.7%. While passive flows into banks (and other blue chips e.g. Wesfarmers) have supported the ASX 100’s outperformance prior to this year, we believe this will unwind as valuations remain overstretched, particular considering their meagre growth outlooks.
In contrast, Figure 1 shows the Small Ords has a lot of breadth and offers greater exposure to more attractive and higher growth sectors. These include retail & consumer, industrials and diversified financials, which have a median FY25-28 EPS CAGR of 11.7%, 9% and 7.2%, respectively.
Less scrutiny, more opportunities
While breaking down the indexes highlights more attractive exposures in small caps, we don’t necessarily recommend buying the index, as there are good stock picking opportunities that stand out above lower quality names at the smaller end of the market.
We highlight two key opportunities later in the note. There are a multitude of reasons as to why there are extensive alpha generation opportunities, including but not limited to:
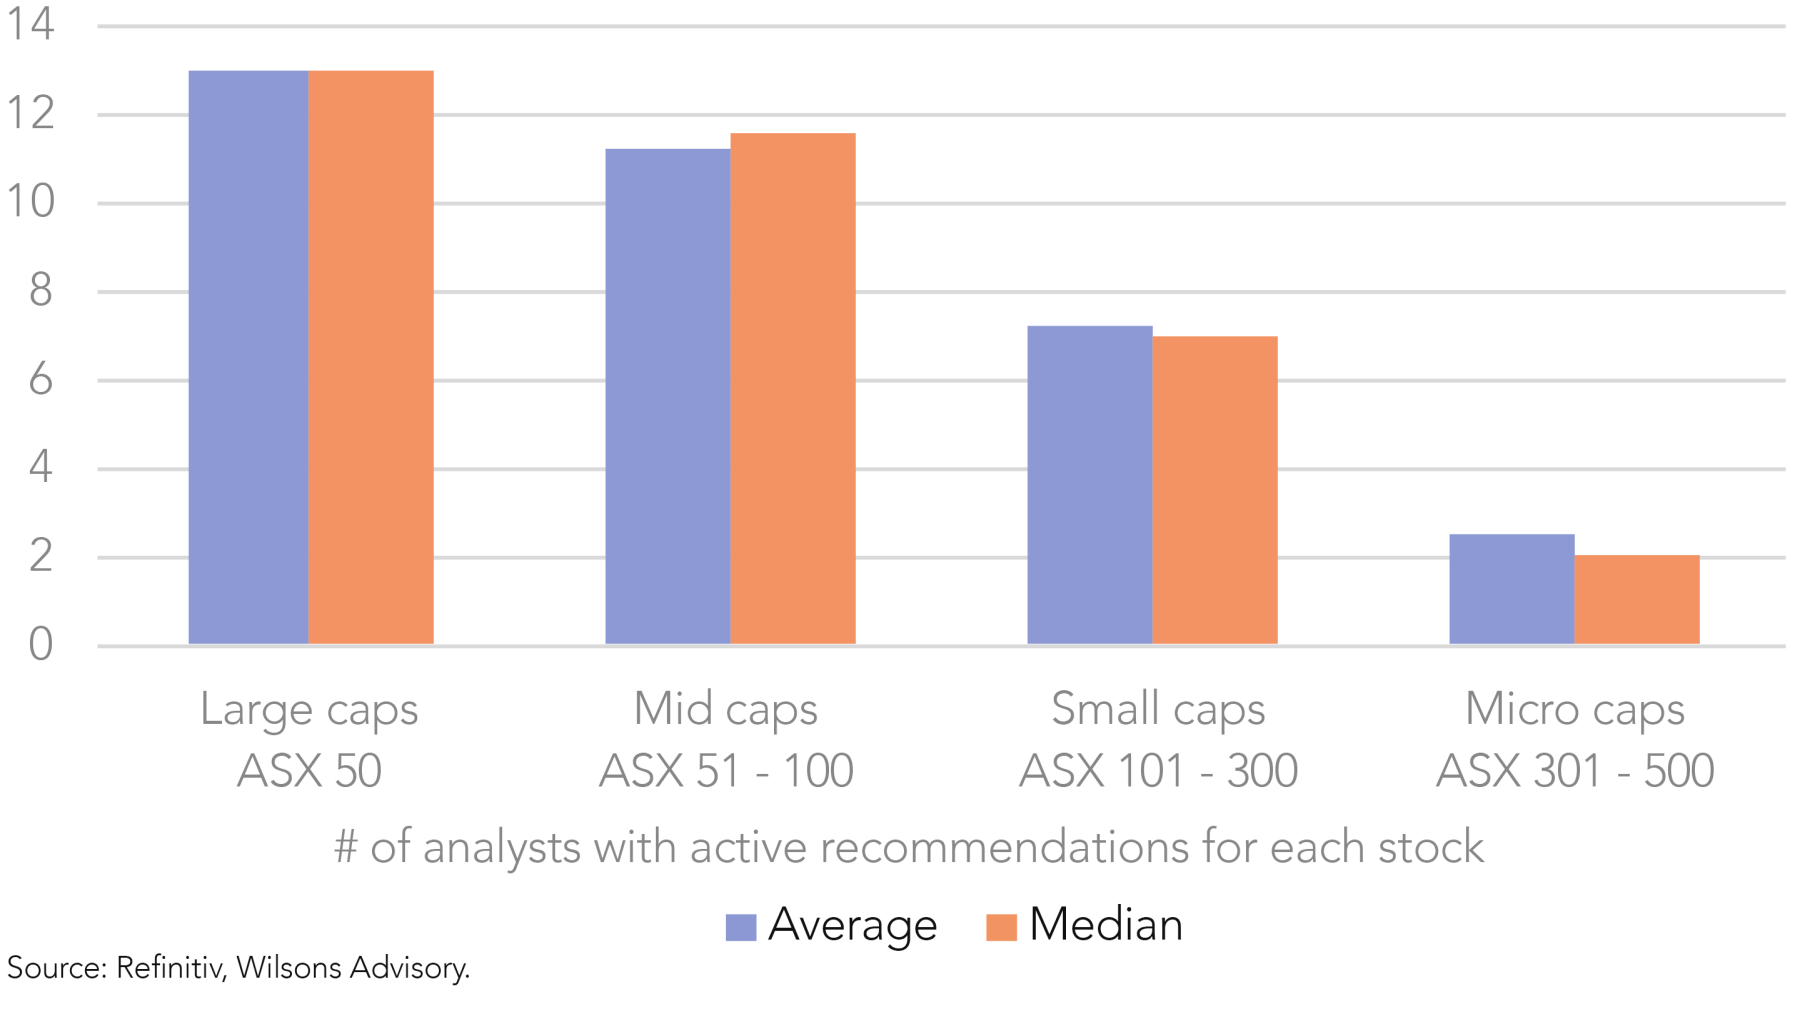
- Lower analyst coverage – as figure 2 shows, detailed analyst coverage drops as stocks get smaller. Small cap companies typically have half the number of analysts covering them compared to large caps.
- Informational asymmetry – fewer investors/institutions monitor small caps closely.
- Mispricing – lower scrutiny results in mispricing as information isn’t efficiently incorporated.
- Less crowding – due to benchmark constraints, institutions often overlook small caps, resulting in less upward buying pressure. This is in contrast to large caps, which are pushed up by passive flows.
- Lower liquidity – although this creates volatility, this can also create attractive entry points.
- More M&A targets – smaller companies are more likely to be takeover targets, and it requires less capital to acquire, providing additional upside opportunities.
Why Now? – Small Caps Are Set Up to Continue Outperformance
Despite recently outpacing larger peers, this trend can continue, supported by rate cut tailwinds, superior earnings growth and relatively cheap valuations.
Rate cut tailwinds
Small caps stand to benefit disproportionately from the RBA’s rate-cutting cycle, with multiple structural tailwinds enhancing their relative appeal.
- Cyclical exposure – smaller companies are concentrated in cyclical sectors such as industrials, consumer & retail and real estate, so lower rates can stimulate demand and drive earnings upgrades.
- Higher leverage – many small caps carry more debt, so falling interest expenses improve the bottom line and reduce balance sheet risks.
- High duration – with much of their FCFs weighted toward the future, lower discount rates increase the present value of future FCFs, supporting valuations.
Earnings growth is superior
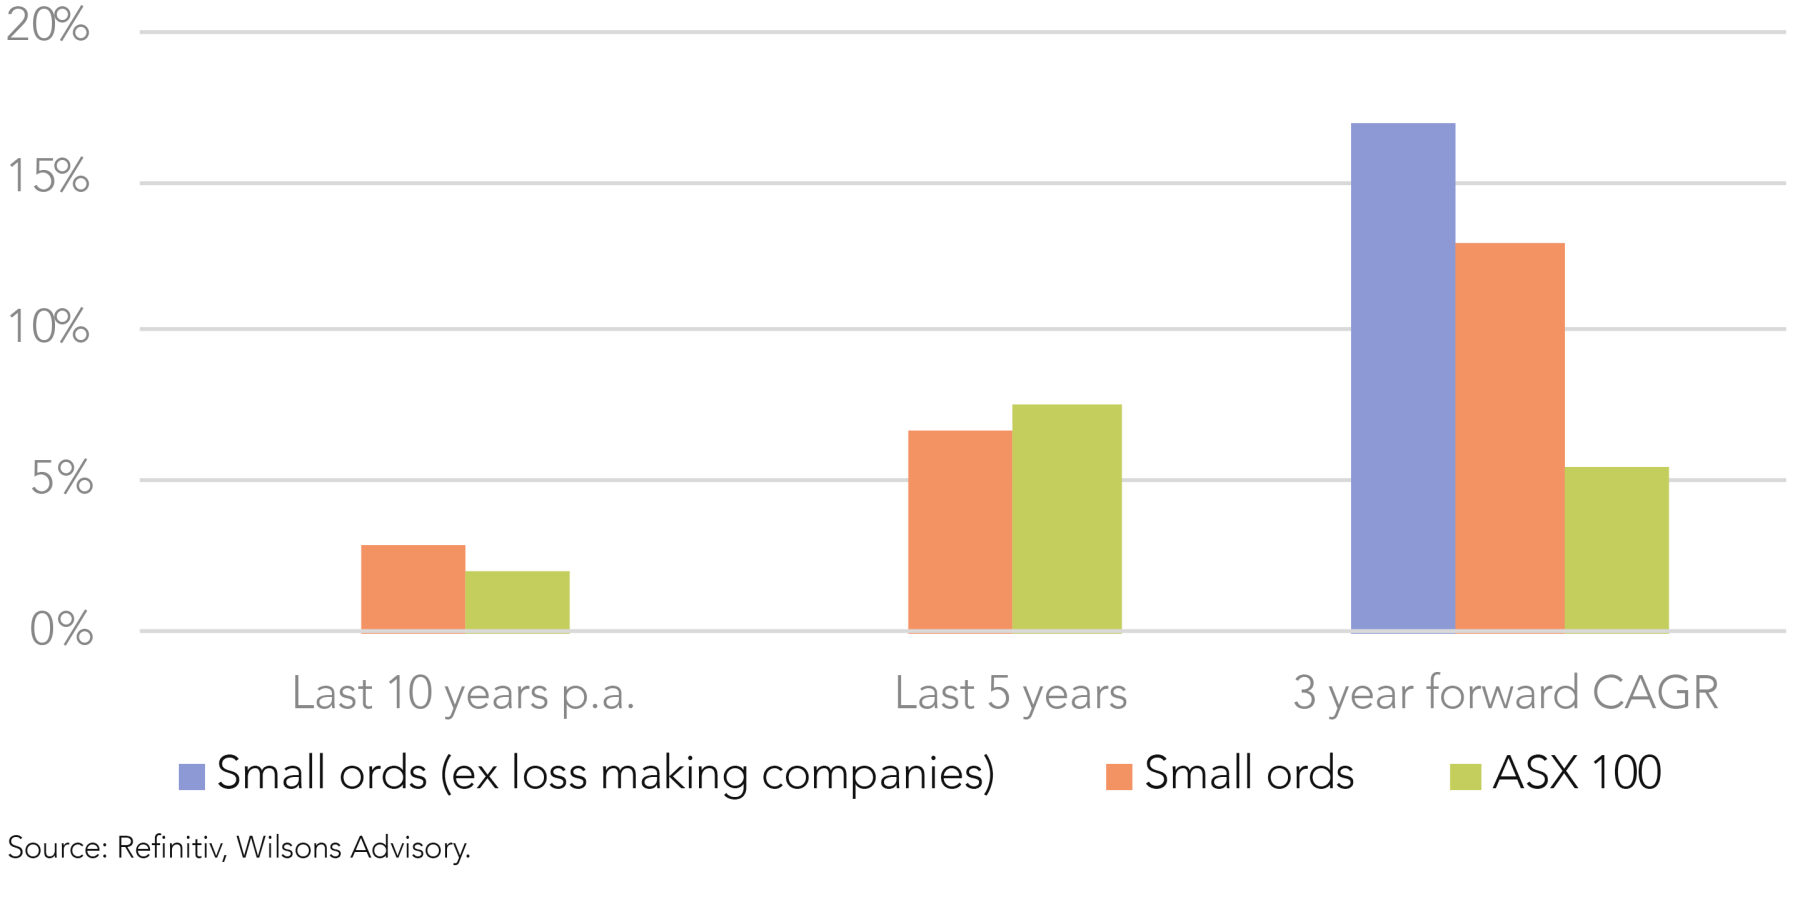
At this current juncture, small cap earnings are at an inflection point, poised to surpass the earnings growth of their larger peers. The inherent tilt of small cap companies toward higher cyclicality and leverage has weighed on their earnings over the past few years – a period marked by inflation, supply chain disruptions and elevated interest rates – allowing larger companies to grow earnings faster, benefitting from more resilient fundamentals including the ability to weather economic cycles and stronger pricing power. The current onset of the easing cycle has resulted in a materially improved forward earnings outlook for small cap companies, as seen in Figure 3. When excluding the impact of loss-making companies, the contrast is even more stark, offering a three year EPS CAGR of 16.9%, compared to the 5.5% CAGR offered by the ASX 100. Even without a re-rate, this is an opportune time to allow earnings to drive share price growth in quality smalls.
Valuations are still relatively cheap
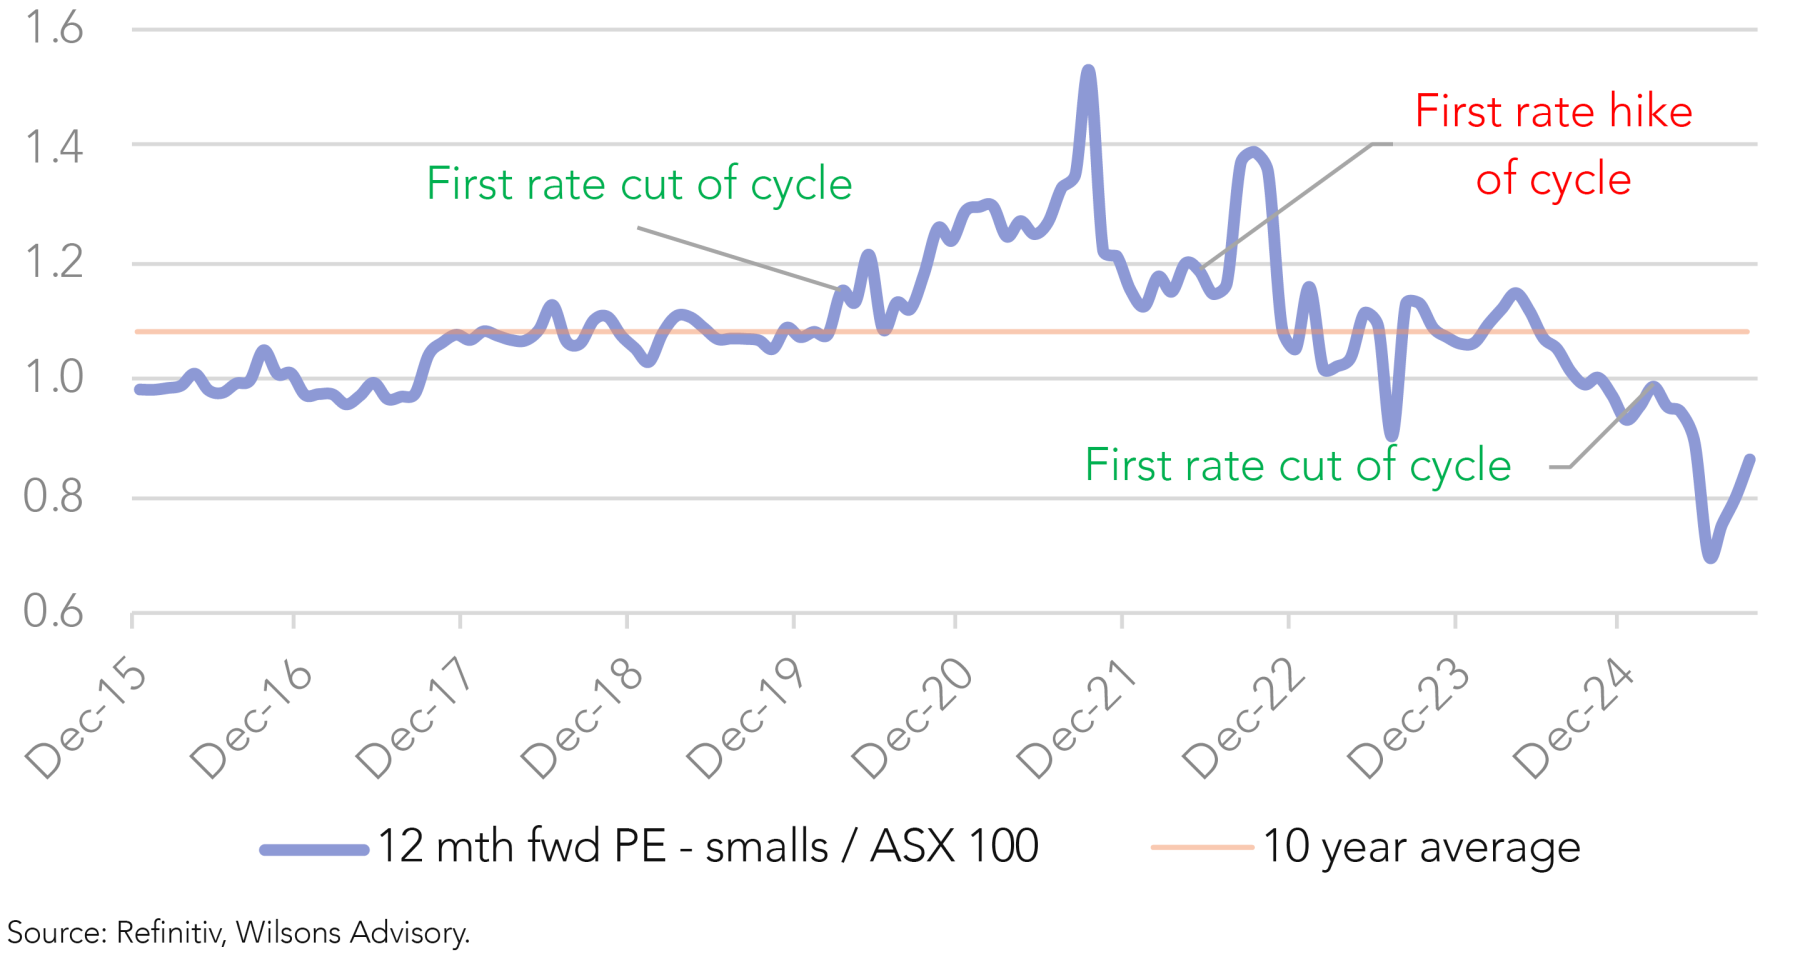
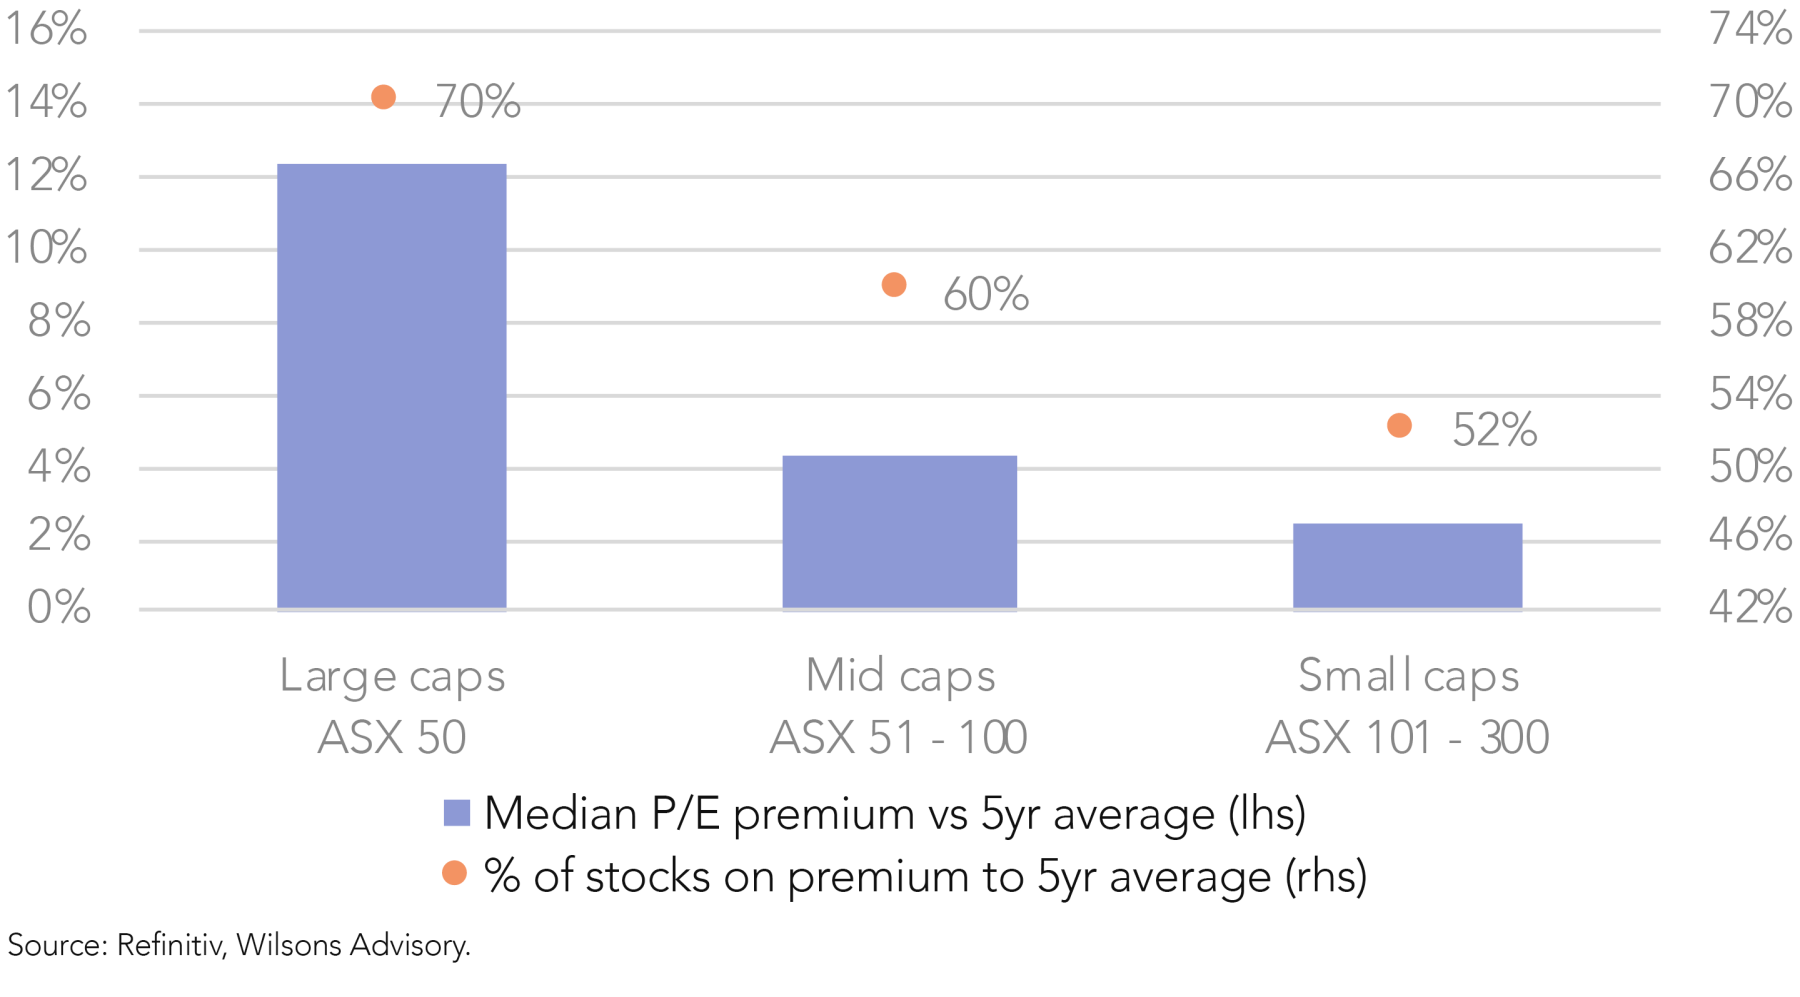
While small caps have outperformed since February as investors acknowledge the earnings boost provided by rate cuts, valuations have yet to overrun and still provide an attractive entry point. Figure 4 shows that while the Small Ords has bounced back from a 30% discount to the ASX 100 P/E to 13%, this is still well below its historical premium of 10%, demonstrating that small cap valuations are far from overextended and still has a viable pathway to continue to re-rate. When compared to its own historical average, large caps screen very expensively, trading at a 13% premium to its five year average P/E, with two-thirds of companies trading at a premium, as seen in Figure 5. This is compared to small caps, trading at just a 1% premium at the index level, while only half of the constituent companies are trading above its own historical average.
Ridley – Packaged and Delivering
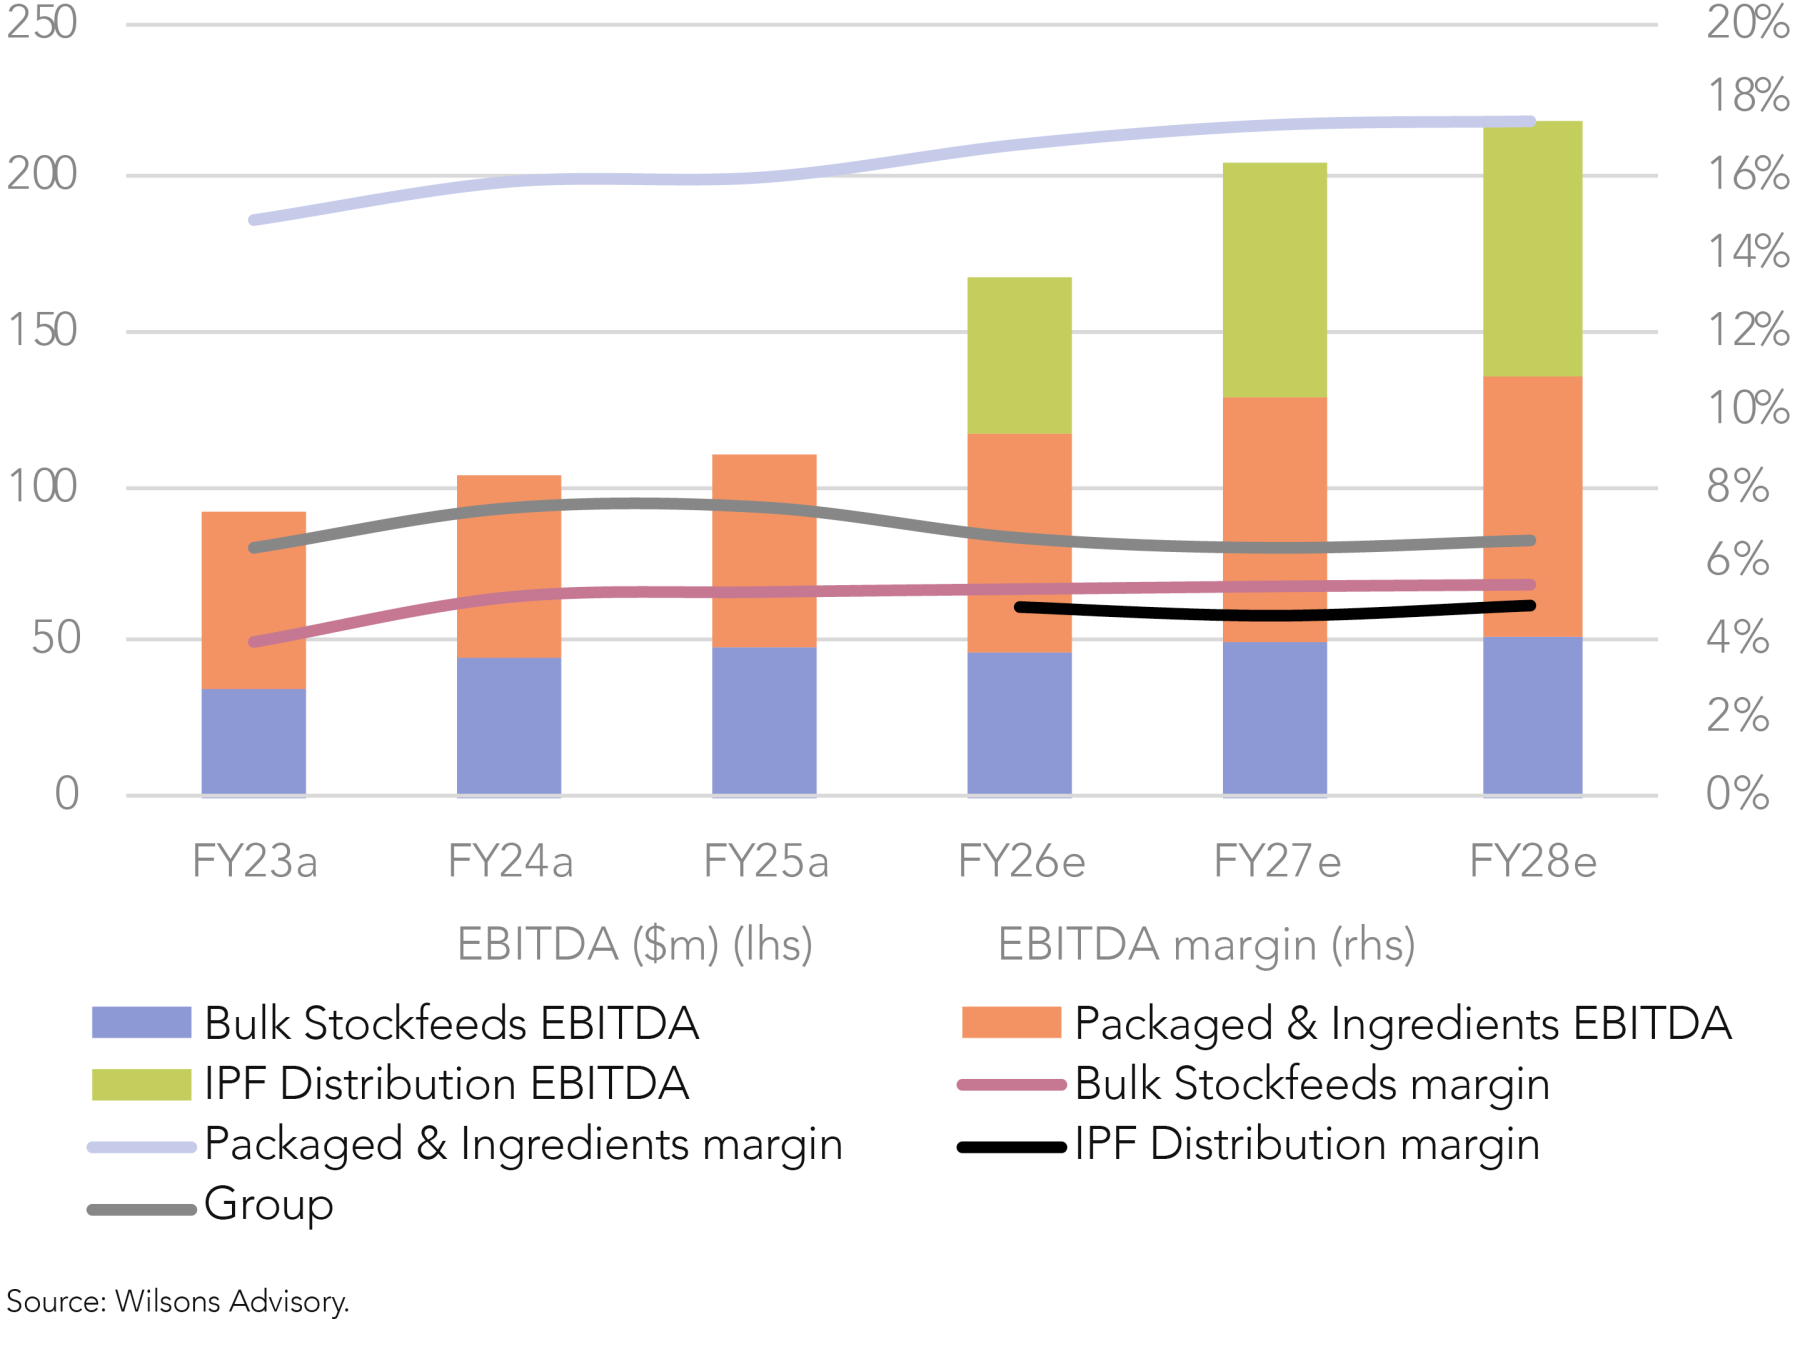
We are attracted to Ridley's (RIC) effective strategy of reinvesting to support volume growth and premiumisation, as well as its highly accretive acquisition of a leading fertiliser distribution business. RIC screens attractively at a forward P/E of 19x while offering three year EPS CAGR of 15%, with the investment thesis outlined below.
Reinvestment in capacity expansion is driving volume growth
As Bulk Stockfeeds is a low margin, volume-driven business, investments to increase its capacity is key to this segment's earnings growth. Management has been focusing on acquiring, expanding and de-bottlenecking stock feed mills, adding incremental capacity. Increasing its scale also lowers the cost per tonne of feed, improving its unit economics and helping defend margins in a competitive market.
Focus on premiumisation is driving margins
Management’s investment in premiumisation continues to deliver a mix shift towards higher margin products. Investment is focused on product development, branding and marketing, packaging, service and customer experience to provide packaged feeds for companion animals, specialised higher-nutrition feeds for livestock and high quality ingredients. With Packaged Feeds and Ingredients delivering ~16% EBITDA margins versus ~5% in Bulk Stockfeeds, growing this segment is a key driver of group margins.
Opportunity to execute the same playbook in fertiliser distribution
RIC has a significant opportunity to deliver upside to its recently acquired fertiliser distribution business (IPF). The market has already rewarded RIC for this disciplined acquisition, delivering pre-synergy EPS accretion of 18%+, rising to 25%+ with straightforward cost synergies. What is underappreciated, however, is management's ability to further optimise IPF's operations by applying the same playbook it has been executing in animal nutrients (i.e. targeted reinvestment, efficiency improvements), which has a similar business model, which could lift accretion to well over 30%.
Nanosonics – A Clean Investment Case
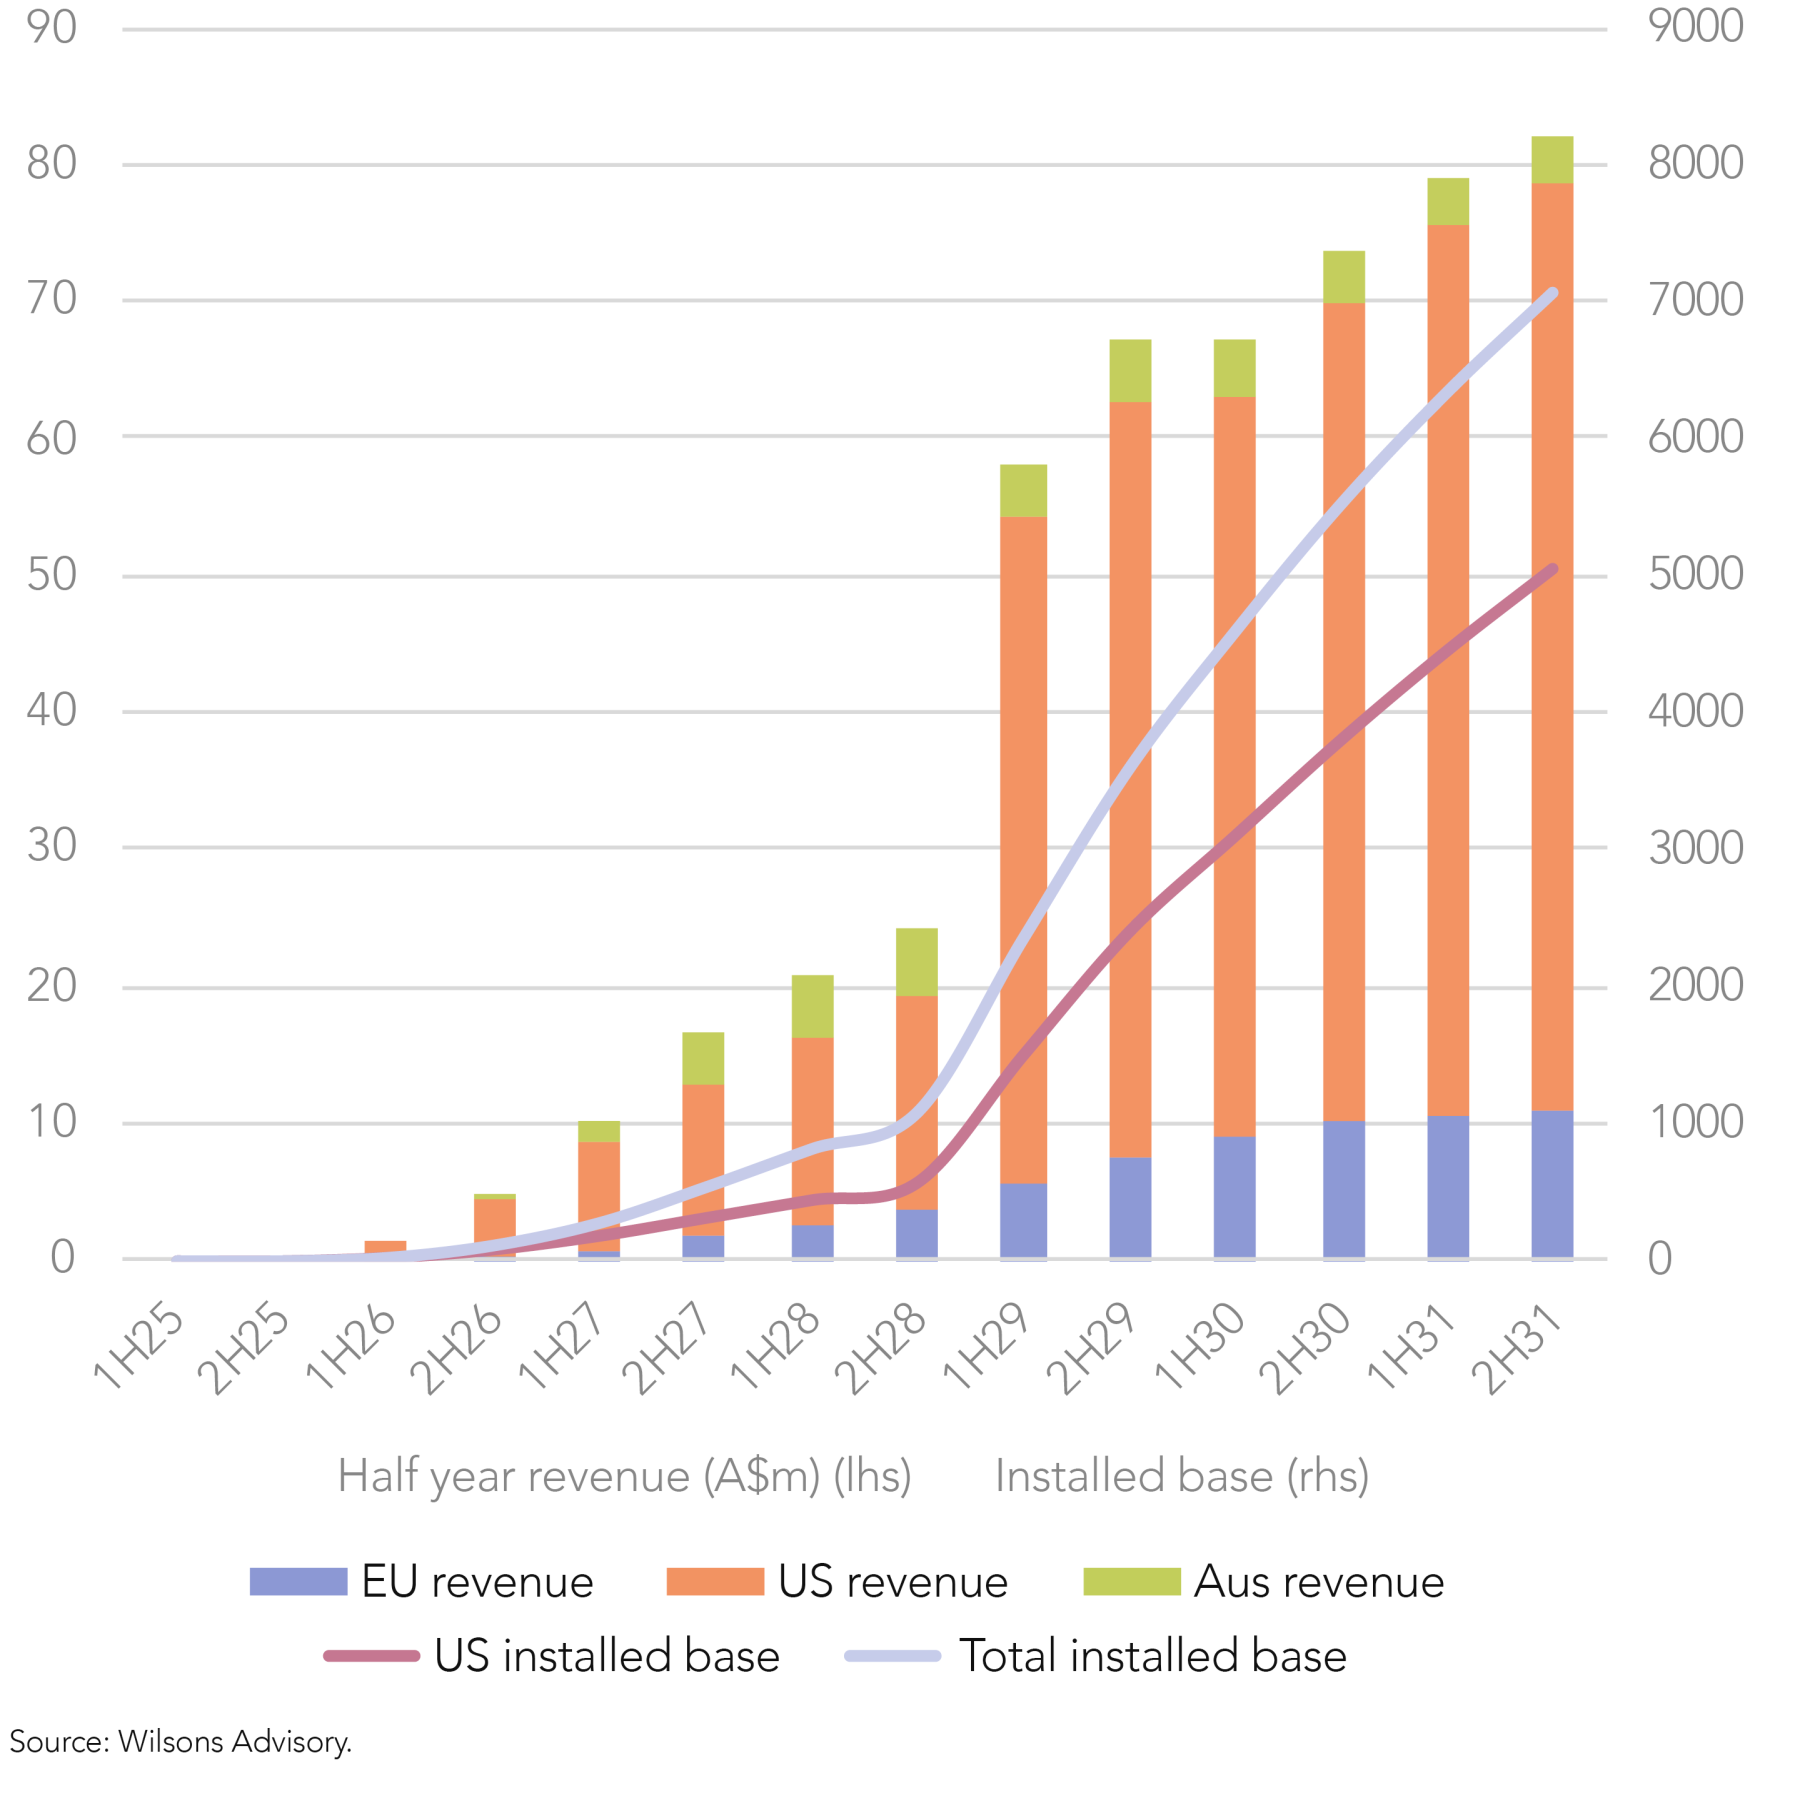
Nanosonics (NAN), a medical device infection solutions company, is well-positioned, supported by the strong performance of its core business, TROPHON, and the upcoming launch of CORIS. Taking a medium-term view, NAN trades on a three-year forward P/E of 36x, offering five year EPS CAGR of 21% and fundamentals of increasing recurring revenues and margin expansion.
TROPHON – strong ecosystem presents long-term upside
The ultrasound transducer disinfection device's ecosystem of consumables and software positions it as a platform and service provider, supporting high gross margins (nearly 80%) and a growing recurring revenue profile. NAN’s FY25 results highlighted this strength: installed base grew 6% while recurring revenue rose 20%, demonstrating how usage naturally scales to deliver consistent cash flows beyond initial sales. Software features, including T2+ traceability and T3 next-generation workflow integration, further embeds TROPHON into hospital operations, which increases switching costs.
CORIS – potential to surpass TROPHON’s opportunity
With its recent FDA approval, CORIS, the first device cleared for automated cleaning of flexible endoscopes, is set to launch in FY26 and deliver material earnings upside.
CORIS has significant potential, sharing TROPHON’s strengths but adding three key advantages:
- No competition – it enters an untapped market as an unrivalled solution, setting a new benchmark and protecting its position with future developments.
- Even higher consumables revenue stream – revenue is more dependent on higher consumable costs per cycle, enabling earlier sales leverage and margin growth.
- Faster adoption expected – the clinical and financial impact of endoscopy-associated infections is greater, supporting faster adoption, with contaminated scopes alone accounting for over 20% of FDA safety communications.
Key Small Cap Opportunities
With the general setup for small caps appearing strong, we have called out two distinct opportunities, Ridley and Nanosonics.
In addition, the table below highlights other noteworthy opportunities covered by our institutional research team.
| Ticker | Name | Sector description | P/E | 5yr avg P/E | +/- 5yr avg | 3yr EPS CAGR | FY26 EPS revisions - last 90 days | PEG ratio | ROIC |
| MGH | Maas Group | Construction & Engineering | 14.2 | 14.4 | -1% | 22% | -2% | 0.6 | 11% |
| ASG | Autosports | Automotive Retail | 13.3 | 8.4 | 59% | 22% | 14% | 0.6 | 8% |
| NAN | Nanosonics | Health Care Supplies | 56.5 | 97.7 | -42% | 20% | -8% | 2.8 | 21% |
| RIC | Ridley | Agricultural Products & Services | 17.3 | 14.8 | 17% | 16% | 0% | 1.1 | 16% |
| TYR | Tyro Payments | Payment Processing | 28.6 | 27.6** | 4% | 13% | -2% | 2.2 | 23% |
| GLF | GemLife Communities | Real Estate Development | 17.3 | 17.1* | 1% | 12%* | 3%* | 1.4 | 7% |
| ARB | ARB | Automotive Parts & Equipment | 29.6 | 27.9 | 6% | 12% | -6% | 2.5 | 18% |
| JIN | Jumbo Interactive | Casinos & Gaming | 15.1 | 22.7 | -34% | 9% | -4% | 1.7 | 72% |
*Having recently listed, we show GLF’s historical P/E average since listing, two year EPS CAGR and revisions from the last 30 days. **TYR's historical P/E average is based on the last 2 years, when EPS became materially positive. Source: Refinitiv, Wilsons Advisory.

Written by
Greg Burke, Equity Strategist
Greg is an Equity Strategist in the Investment Strategy team at Wilsons Advisory. He is the lead portfolio manager of the Wilsons Advisory Australian Equity Focus Portfolio and is responsible for the ongoing management of the Global Equity Opportunities List.
About Wilsons Advisory: Wilsons Advisory is a financial advisory firm focused on delivering strategic and investment advice for people with ambition – whether they be a private investor, corporate, fund manager or global institution. Its client-first, whole of firm approach allows Wilsons Advisory to partner with clients for the long-term and provide the wide range of financial and advisory services they may require throughout their financial future. Wilsons Advisory is staff-owned and has offices across Australia.
Disclaimer: This communication has been prepared by Wilsons Advisory and Stockbroking Limited (ACN 010 529 665; AFSL 238375) and/or Wilsons Corporate Finance Limited (ACN 057 547 323; AFSL 238383) (collectively “Wilsons Advisory”). It is being supplied to you solely for your information and no action should be taken on the basis of or in reliance on this communication. To the extent that any information prepared by Wilsons Advisory contains a financial product advice, it is general advice only and has been prepared by Wilsons Advisory without reference to your objectives, financial situation or needs. You should consider the appropriateness of the advice in light of your own objectives, financial situation and needs before following or relying on the advice. You should also obtain a copy of, and consider, any relevant disclosure document before making any decision to acquire or dispose of a financial product. Wilsons Advisory's Financial Services Guide is available at wilsonsadvisory.com.au/disclosures.
All investments carry risk. Different investment strategies can carry different levels of risk, depending on the assets that make up that strategy. The value of investments and the level of returns will vary. Future returns may differ from past returns and past performance is not a reliable guide to future performance. On that basis, any advice should not be relied on to make any investment decisions without first consulting with your financial adviser. If you do not currently have an adviser, please contact us and we would be happy to connect you with a Wilsons Advisory representative.
To the extent that any specific documents or products are referred to, please also ensure that you obtain the relevant disclosure documents such as Product Disclosure Statement(s), Prospectus(es) and Investment Program(s) before considering any related investments.
Wilsons Advisory and their associates may have received and may continue to receive fees from any company or companies referred to in this communication (the “Companies”) in relation to corporate advisory, underwriting or other professional investment services. Please see relevant Wilsons Advisory disclosures at www.wilsonsadvisory.com.au/disclosures.
