The US market has backed off from record highs this past week. Despite the modest pullback, the S&P500 is still boasting a strong 12 month rolling price gain of 14%, while the index is up 28% from its April sell-off lows.
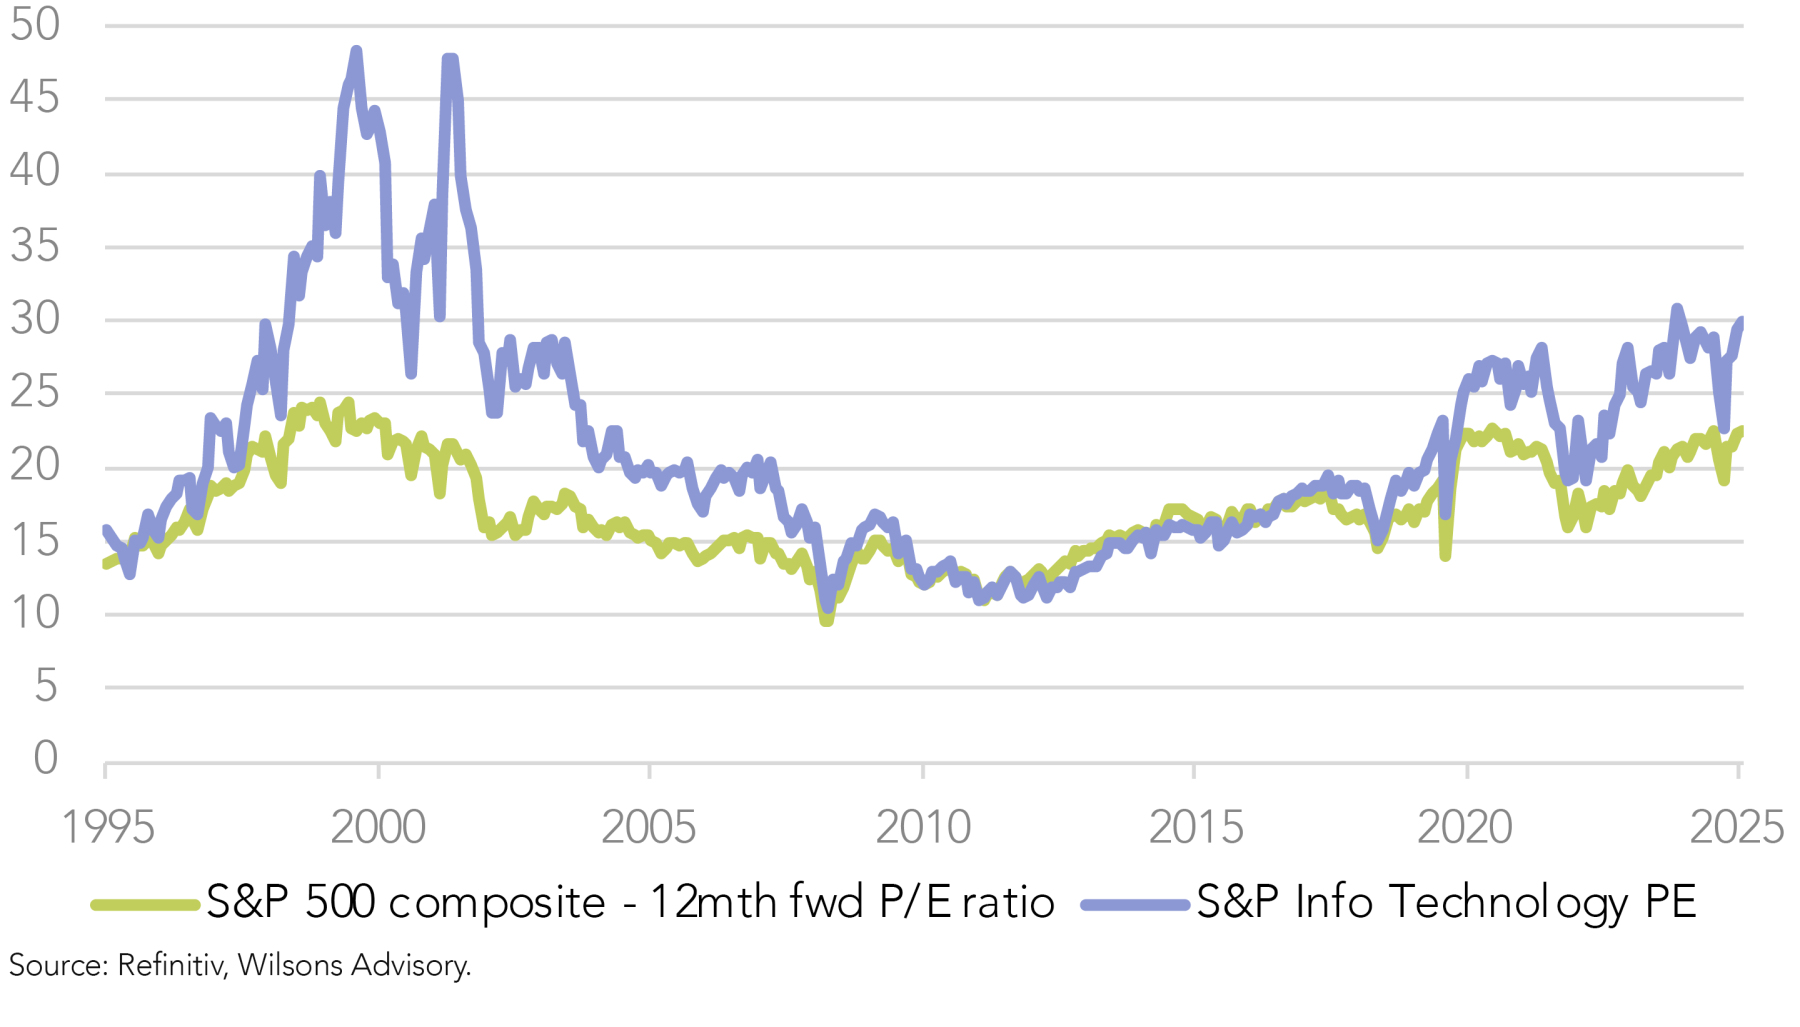
Panning further out, the US market has delivered an impressive ~16% and ~15% total return over the past five and 10 years, respectively. From a valuation perspective, the US P/E multiple of 22.5x (12 month forward EPS) sits very close to the highest level since the tech bubble peak of 2000 and well above even more recent 5 year average levels (20x).
Soapy Bubble or Sober Bull?
Is this another bubble, or is this a bull market driven by a rationally bullish assessment of the fundamental earnings outlook? Bubbles are of course easier to identify in hindsight rather than ahead of the pop. However, it is important to note that the current bull run does have a proven and robust foundation from an earnings perspective.
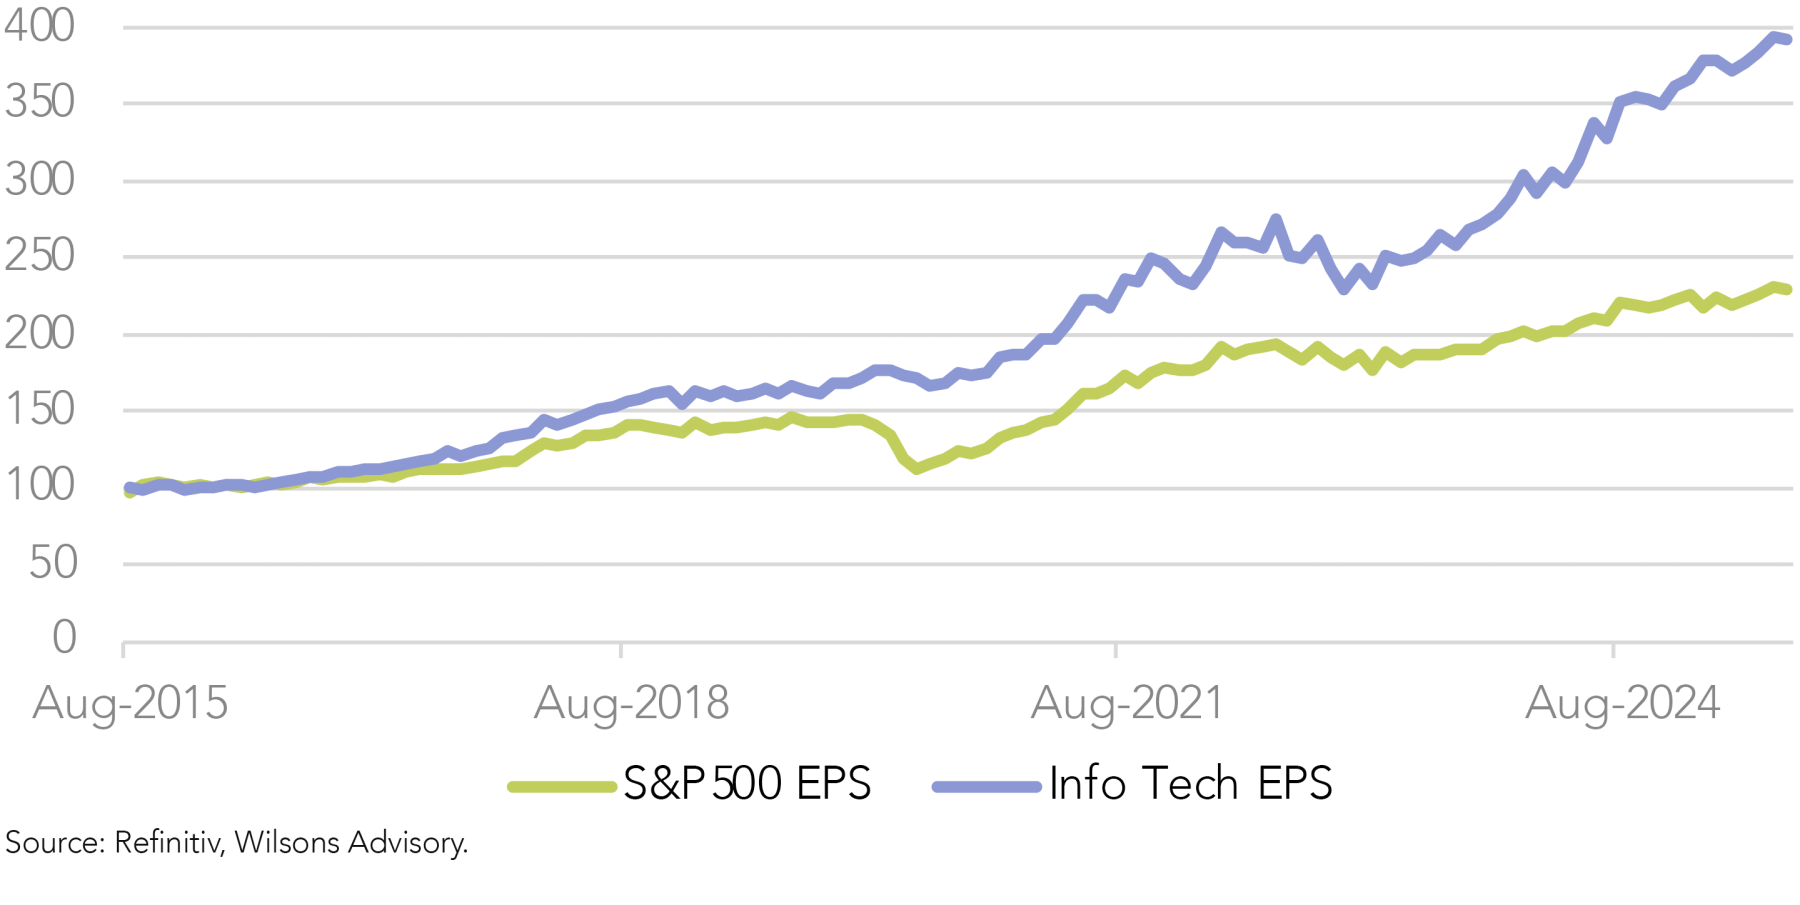
As we have highlighted on previous occasions, the last 10 years has been a period of strong earnings delivery in terms of aggregate earnings growth flowing from the US equity market.
The recent US reporting season delivered another quarter of double digit earnings growth (~12%) despite concerns over the impacts from tariffs and evidence of a slowing US economy. Tech has led the way over the last 10 years and once again over the last 12 months. Market estimates continue to suggest Tech earnings leadership over the coming year and beyond.
Earnings growth is more subdued on an “ex-Tech” basis, particularly over the last 12 months, but it is still positive. Hopes of a reacceleration in economic growth off the back of Fed easing is giving the market hope of an improvement in
ex-Tech earnings growth into 2026.
How concentrated is the market's recent advance?
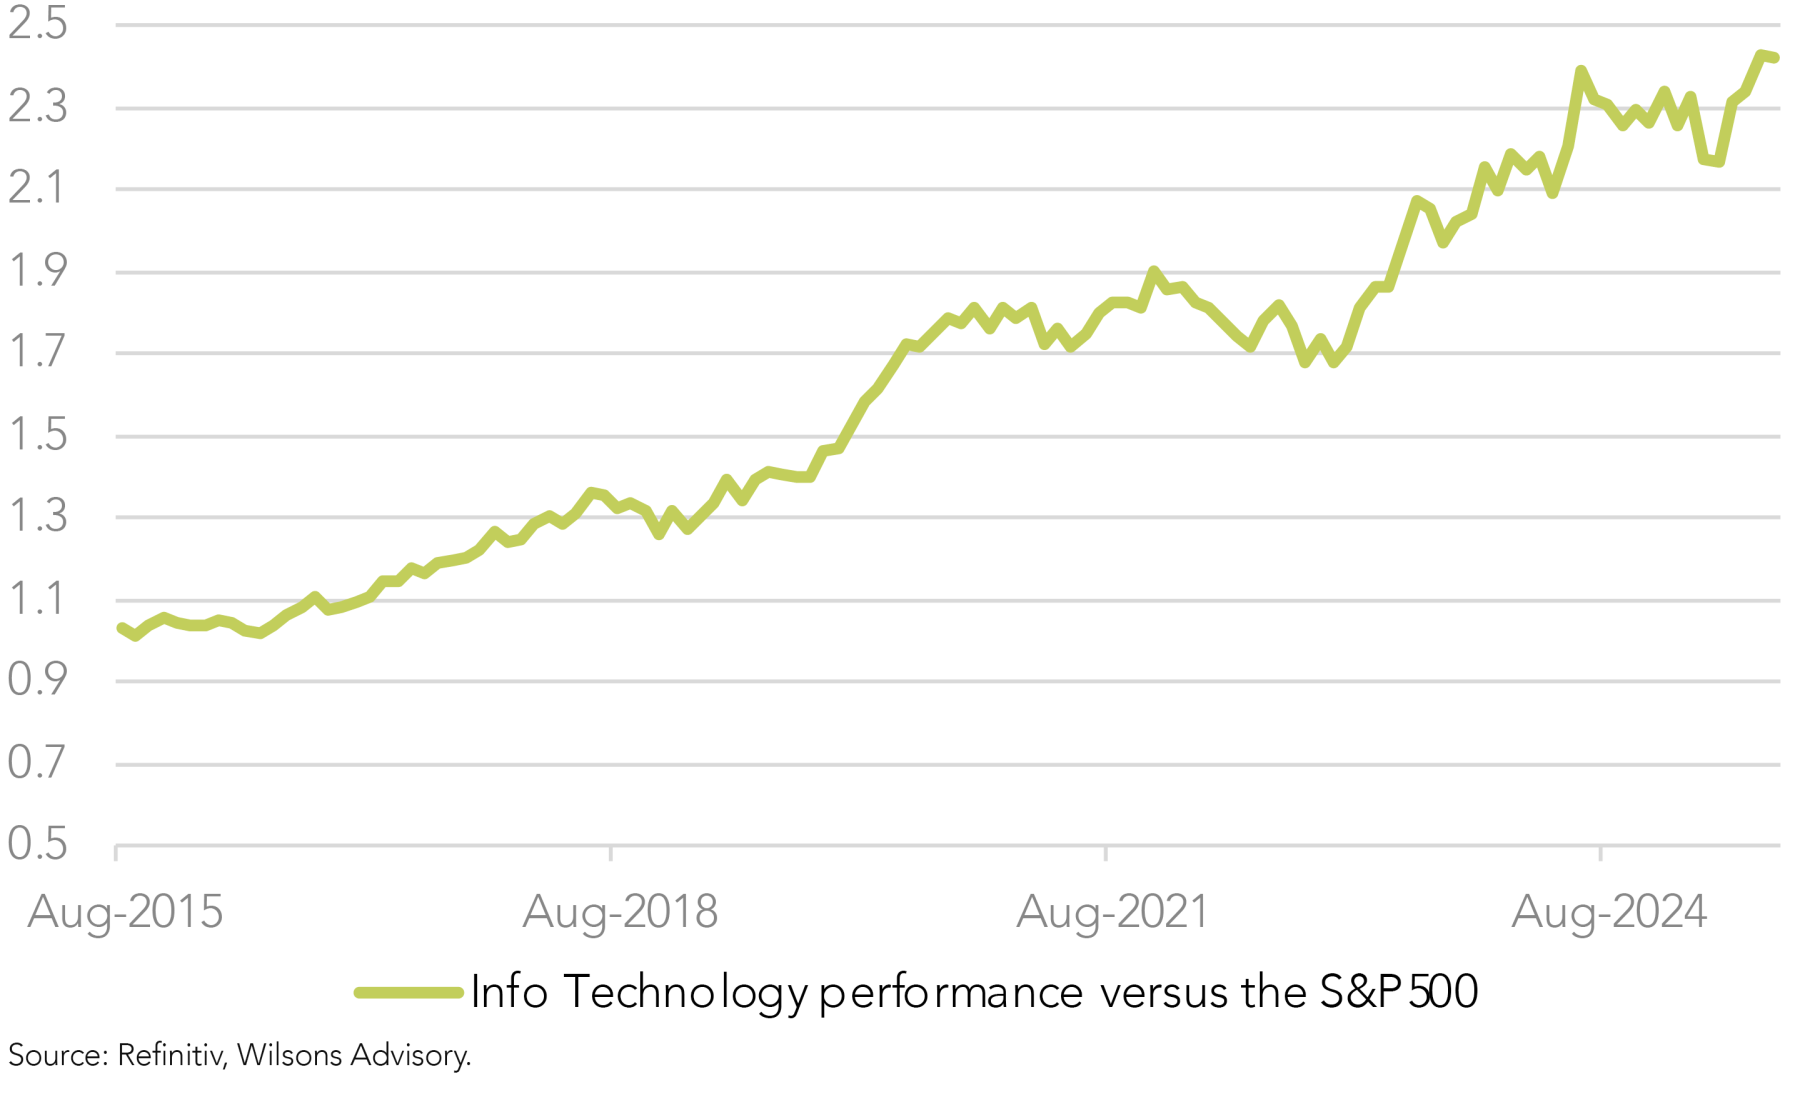
Tech is by a wide margin the best performer since the market’s April lows. Market concentration, or “Tech leadership” has been a periodic concern in recent years.
These concerns have re-emerged in recent weeks following another strong reacceleration in the Tech sector. After a significant 26% retracement in the first few months of this year, Tech has surged over 50% since the market’s April low to fresh all-time highs, before backing off in recent days. This compares to a market rebound of 28%. Panning out to a longer time horizon, the Tech sector is clearly the best performing sector over the past five and 10 years.

The US Market has Evolved
The US Tech sector is not completely straightforward to define. The S&P IT sector is the core of the Tech trade (dominated by the likes of Nvidia, Microsoft and Apple) and currently stands at 34% of US market capitalisation. In addition, since a reclassification in 2018 the Communication Services sector is essentially an extension of the Tech sector, being dominated by the likes of Alphabet, Meta and Netflix, and stands at a sizeable 10% of the total market.
Furthermore, Amazon is the largest stock in the US Consumer Discretionary sector at ~4% of the S&P500. It would also be considered a Tech stock, boasting a combination of the world’s largest cloud business and its dominant online retail franchise. Using this “Tech plus” definition suggests a current weighting of ~48% for the Tech sector.
While not every Tech constituent has outperformed, the outperformance is much broader than just the 6 or 7 mega caps. It is possible that the market is too bullish on the Tech trade in a broad sense, but there is certainly broad participation and plenty of earnings growth accompanying the Tech trade in this cycle.
How much does Tech account for the elevated US multiple?
One difficulty in assessing the valuation of the US market versus its own history is the growth in the relative size of the Tech sector. The IT sector made up only 6% of market value in 1990 and as recently as 10 years ago was around 15%, while now on our “Tech plus” definition it is close to 50%.
Notably, the Information Technology has not always been a premium sector. The sector did rise to its all-time high P/E in the Tech bubble of 2000, but as recently as ten years ago it was trading on 15.8x, compared to the market P/E of 16.5x. Over the past 10 years, the IT sector has subsequently re-rated to ~30x earnings (Communication Services trades on a more modest 20x).
While well below the levels of the 2000 bubble, the IT sector is at a 33% premium to the market PE and a 36% premium to its own 10 year average P/E level.

However, in the context of 14% p.a. earnings growth over the last 10 years and its very recent record of over 19% growth over the past year, the Tech sector doesn’t look to be in a valuation bubble, unless the earnings strength is set to run out of steam.
Looking more broadly, there are a number of sectors that are at a premium to their 10 year average. The Tech sector, however, commands the highest premium and is responsible for the lion’s share of the US market’s re-rating.

Pullback Plausible, but US Prospects Remain Positive
In summary, it is perhaps somewhat cautionary that the market is trading at a significant premium to historic valuation levels and that outperformance has once again been concentrated in the Tech sector.
However, the strongest argument refuting bubble talk is that US Tech, while trading at elevated multiples versus history, has a track record of delivery that has been evident over the past 10 years, including at the latest reporting season. Recent results continue to suggest US Tech is well placed for growth from the AI revolution, although the AI story is still evolving.
Our tactical view remains that the market is overdue for at least a moderate correction. If a correction does indeed transpire in coming months, it is probable that once again Tech leads the market down. It is particularly likely to be the case if driven by a spike in long-term interest rates, although perhaps not as clear if it is driven by economic slowdown fears. Longer term structural prospects for US Tech still look attractive in our view and bubble talk around the US equity market is likely to continue to prove wide of the mark.

Written by
David Cassidy, Head of Investment Strategy
David is one of Australia’s leading investment strategists.
About Wilsons Advisory: Wilsons Advisory is a financial advisory firm focused on delivering strategic and investment advice for people with ambition – whether they be a private investor, corporate, fund manager or global institution. Its client-first, whole of firm approach allows Wilsons Advisory to partner with clients for the long-term and provide the wide range of financial and advisory services they may require throughout their financial future. Wilsons Advisory is staff-owned and has offices across Australia.
Disclaimer: This communication has been prepared by Wilsons Advisory and Stockbroking Limited (ACN 010 529 665; AFSL 238375) and/or Wilsons Corporate Finance Limited (ACN 057 547 323; AFSL 238383) (collectively “Wilsons Advisory”). It is being supplied to you solely for your information and no action should be taken on the basis of or in reliance on this communication. To the extent that any information prepared by Wilsons Advisory contains a financial product advice, it is general advice only and has been prepared by Wilsons Advisory without reference to your objectives, financial situation or needs. You should consider the appropriateness of the advice in light of your own objectives, financial situation and needs before following or relying on the advice. You should also obtain a copy of, and consider, any relevant disclosure document before making any decision to acquire or dispose of a financial product. Wilsons Advisory's Financial Services Guide is available at wilsonsadvisory.com.au/disclosures.
All investments carry risk. Different investment strategies can carry different levels of risk, depending on the assets that make up that strategy. The value of investments and the level of returns will vary. Future returns may differ from past returns and past performance is not a reliable guide to future performance. On that basis, any advice should not be relied on to make any investment decisions without first consulting with your financial adviser. If you do not currently have an adviser, please contact us and we would be happy to connect you with a Wilsons Advisory representative.
To the extent that any specific documents or products are referred to, please also ensure that you obtain the relevant disclosure documents such as Product Disclosure Statement(s), Prospectus(es) and Investment Program(s) before considering any related investments.
Wilsons Advisory and their associates may have received and may continue to receive fees from any company or companies referred to in this communication (the “Companies”) in relation to corporate advisory, underwriting or other professional investment services. Please see relevant Wilsons Advisory disclosures at www.wilsonsadvisory.com.au/disclosures.
