
The Wilsons Advisory Global Equity Opportunities List harnesses research from our partner Craigs to highlight attractive investment ideas across global equity markets with a distinct focus on high quality, growth-oriented companies.
Our Approach to Global Investing
Long-term investment horizon
Buying shares in outstanding businesses and owning them for the long-term.
Quality focus
High quality businesses are those with a track record of generating returns on invested capital (ROIC) above their cost of capital over time. The focus of this strategy is on world-class franchises with high ROICs, strong management teams and durable competitive advantages underpinned by network effects (e.g. Mastercard), scale advantages (e.g. Walmart), switching costs (e.g. Microsoft), brand equity (e.g. L’Oréal) and intellectual property (e.g. Nvidia). In combination, these characteristics underpin strong and resilient cash flows through economic cycles.
Growth bias
The focus is on identifying companies that are likely to deliver above-market earnings growth over time. Over the long-term, earnings growth is the primary determinant of shareholder returns in our view. Therefore, the strategy is comfortable paying a (reasonable) premium for businesses with exceptional long-term growth potential noting the market often undervalues the long-term compounding ability of genuine secular growth opportunities in the short-run.
Structural growth thematics
The strategy is exposed to a number of ‘megatrends’ that are expected to materially change the way society operates and should underpin significant long-term earnings growth over time for the companies leveraged to them, including:
- Cloud Transition - the structural transition of workloads onto the cloud, and exponential growth in the quantum of data created, is benefiting the major cloud service providers (i.e. Amazon, Microsoft, Alphabet,) and semi-conductor companies (i.e. NVIDIA).
- Artificial Intelligence – the most immediate beneficiaries of Generative AI are the semiconductor designers and cloud service providers, which provide the infrastructure that powers AI workloads. Several software companies have also started to integrate AI into their offerings, including Microsoft’s Co-pilot, Adobe’s Firefly, and Salesforce’s Sales GPT.
- Innovative Healthcare – Pharmaceutical, lifescience, and medical technology companies are exposed to several secular tailwinds, including ageing populations and the rising prevalence of chronic disease, which are driving increased demand for healthcare. Scientific breakthroughs have also underpinned the creation of better drugs and treatment methods. The rapid growth in the use of GLP-1 drugs to treat weight loss is one such example. Eli Lily, Thermo Fisher, Roche, Intuitive Surgical, and Johnson & Johnson provide exposure to this thematic.
- Digital Economy - the ‘digitalization’ of information, commerce, payments, advertising, and work processes is providing structural tailwinds for a wide range of companies including Adobe, Salesforce, Alphabet, Amazon, Tencent, Apple, and Microsoft.
- Energy Transition – to achieve 'net zero', the amount of investment into energy infrastructure will need to rise substantially over the coming decades. The rollout of renewables represents a significant change to the electrical value chain which will require an expansion and modernisation of grid infrastructure, and such, will drive an upward inflexion in demand for Schneider Electric's products.
- Entertainment on Demand – the growing popularity of on-demand content and live online gaming is a tailwind for streaming providers like Disney (via Disney+, Hulu), Apple (i.e. Apple TV, Apple Music), Amazon (i.e. Amazon Prime, Twitch), Alphabet (i.e. YouTube), and digital gaming platforms like Microsoft’s Xbox.
- Emerging Asian Consumer –the Asian middle class is expected to grow by ~1.5 billion people between 2020-2030, which is creating a large consumer class driving structural growth in demand for goods like cosmetics (i.e. L’Oréal) as well as technology/social media (i.e. Tencent).


Q4 Earnings Were Much Stronger Than Expected
The Q4 2024 US reporting season painted a picture of strong corporate earnings across most sectors, although management commentaries provided an insight into near-term uncertainties, particularly concerning the impact of tariffs.
S&P 500 companies grew earnings in aggregate by 18.3% (year-on-year), the highest level of growth since Q4 2021 (which was cycling weak Covid comps). With expectations of 11.7% growth, the corporate earnings environment was much stronger than expected, with industry aggregate earnings surprises led by Consumer Discretionary (13.1% surprise), Financials (12.6%) and Industrials (10.6%).


Earnings growth broadening beyond tech companies
With earnings growth in 10 out of 11 GICS sectors (and double-digit growth in seven sectors), a key takeaway is that earnings growth has been broadening out beyond mega cap tech companies. Earnings growth from Financials (55.9%) (this figure is inflated from cycling one-off impacts in the pcp, but its growth was still strong with with these impacts excluded), Communication Services (29.6%) and Consumer Discretionary (27.1%) sectors paced Technology (18%). However, there were sectors missing out on this growth, with Industrials, Materials and Consumer Staples seeing low single digit growth, and Energy experiencing negative growth, impacted by lower energy prices.
Outlook Clouded by Tariffs
Tariff uncertainty has contributed to negative earnings revisions
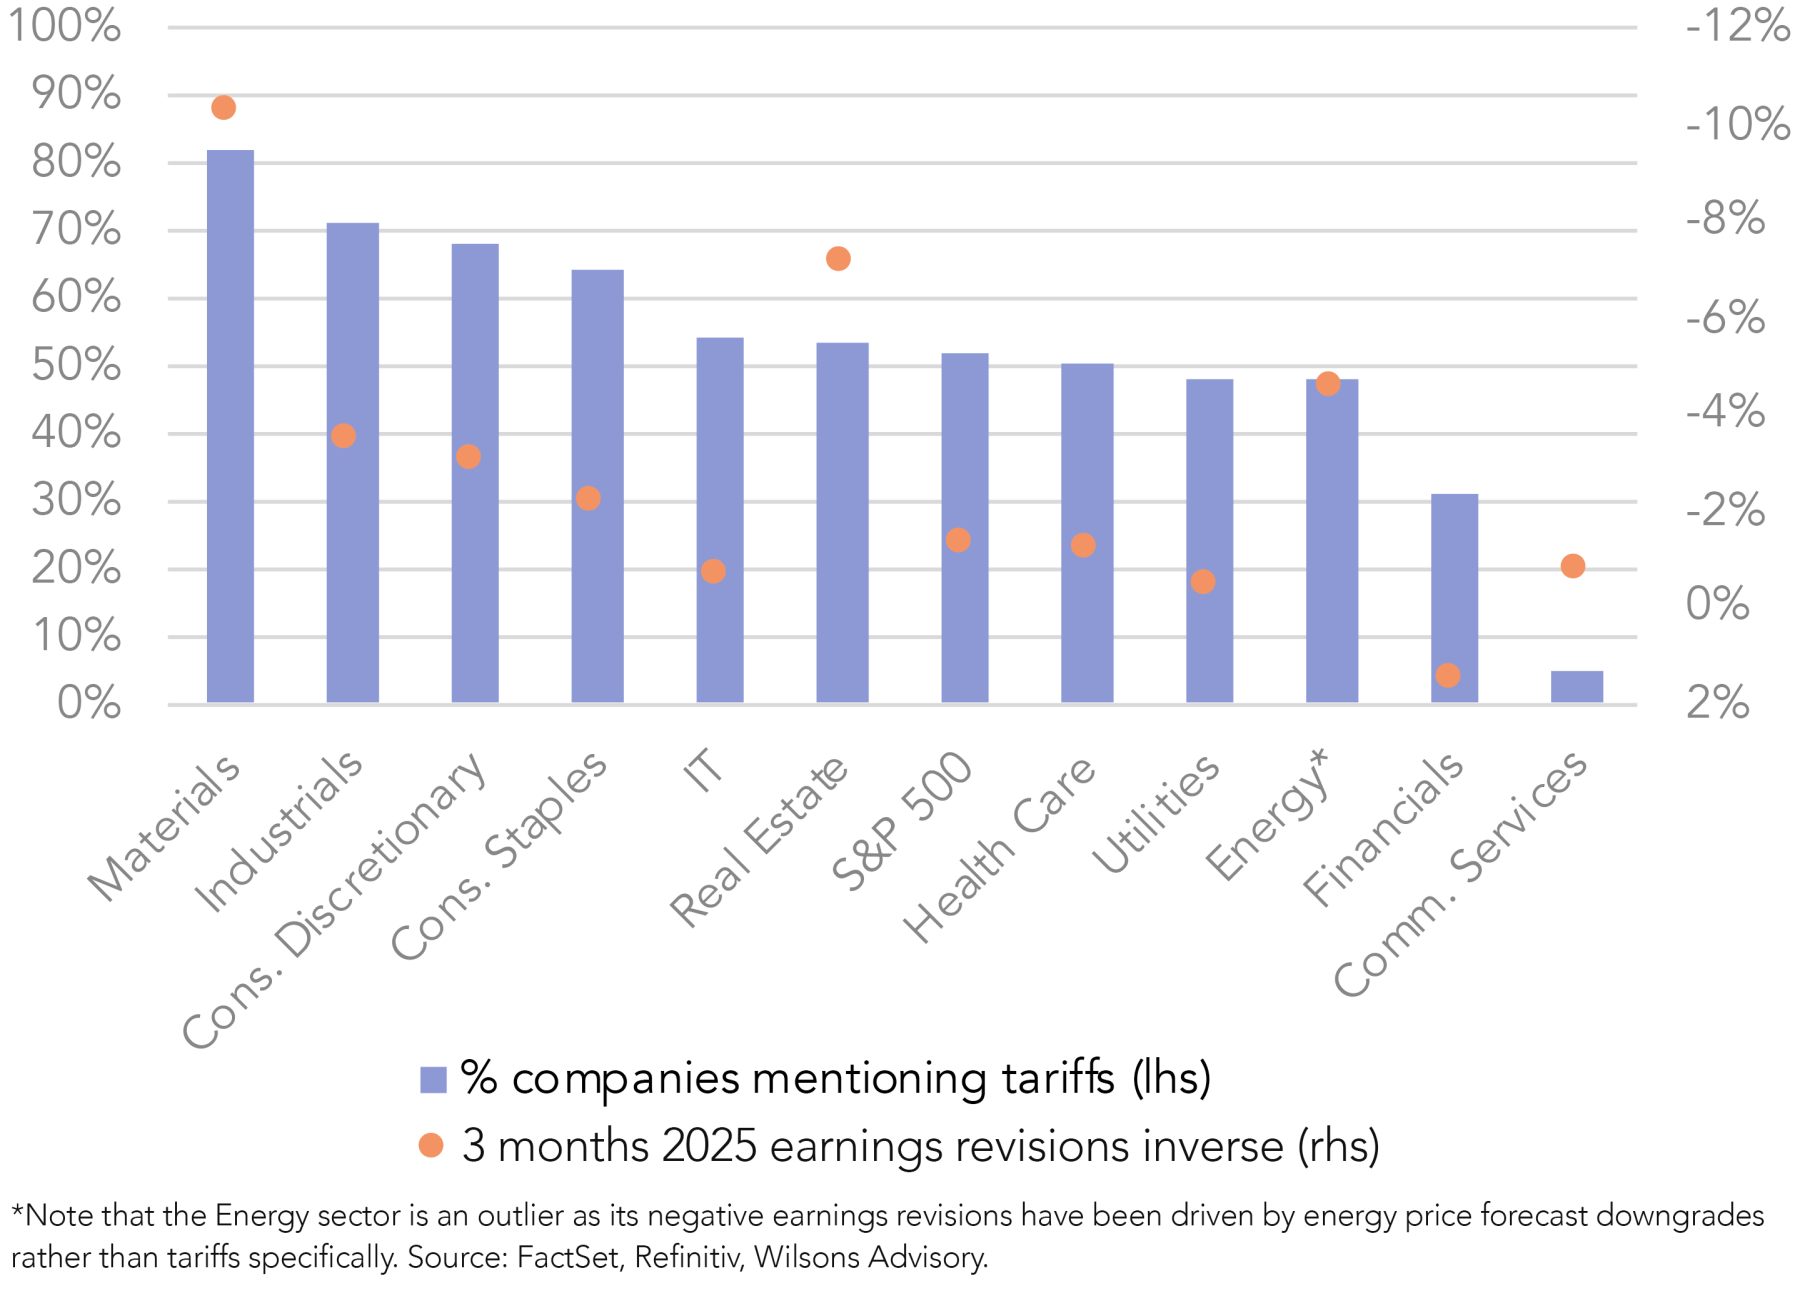
Despite strong a Q4 2024 earnings performance, a ramp up in management commentary on tariff uncertainty was perhaps a harbinger for the market correction seen from mid-February following further tariff news. Approximately 260 companies in the S&P 500 mentioned ‘tariff/s’, the highest level in decades. This was up from ~80 mentions last quarter and a recent high of ~185 in Q2 2018, in Trump’s first term.

With this in mind, it comes as little surprise that the biggest downwards earnings revisions have been in the sectors that have mentioned tariffs the most (Materials, Industrials, Staples and Discretionary). During and since earnings season, major tariff policies/considerations have been announced, notably affecting companies with significant operations in China, automakers and some European luxury goods (particularly alcohol).
Furthermore, earnings calls gave insight into concerns about the US consumer, which has been reflected by a decline in the consumer confidence index. However, it is important to note that mentions of ‘recession’ is near 10-year lows, showing that a slowdown rather than recession was the main concern.
These factors have brought resulted in Q1 2025 earnings growth projections being revised down from 11.5% (expectations in December last year) to 7.3% (current expectations), showing the impacts tariffs are projected to have either directly or indirectly (i.e. slowing economic activity including business investment and consumer spending).
Searching for Post-Correction Buying Opportunities
As mentioned, concerns and news flow surrounding Trump’s tariffs resulted in a large sell-off beginning in mid-February. After hitting its peak on February 19, the S&P 500 sold-off over 10% in the following three weeks, entering correction territory, although there has been a small bounce back. The correction was driven by risk-off sentiment, the implementation of tariffs, retaliatory measures and escalating trade tensions, and Trump’s refusal to rule out a recession, which were the potential concerns that companies were previously citing in earnings calls.
Read Trump Slump
The Magnificent 6 has been heavily sold-off despite remaining high-quality
This correction has presented compelling buying opportunities, particularly in high-quality growth companies. The Magnificent 6 (Mag 7 ex Tesla) has seen its PE de-rate from 29.5x to 25.2x during the market correction period (it has now ticked back up to 25.5x), which was a larger de-rate than the market. Furthermore, each Magnificent 6 company had a larger price drawdown than the S&P 500 (see figure 7), despite the market in aggregate having a larger earnings downgrade than any of these six companies (we excluded Tesla as it did have a large consensus earnings downgrade). We also note that these companies have delivered outsized returns over the years and we expect this to continue.
Although a couple of these companies will be affected by tariffs (Apple may need to pass on tariffs), most of the Magnificent 6 are relatively unaffected, with key drivers such as AI and cloud experiencing strong secular growth, regardless of concerns about global economic cycle. As a result, this group of outstanding companies are now trading at more attractive entry points.


Alphabet – our top search result
Currently, the most compelling buy is Alphabet, the owner of Google. Since Alphabet’s year-to-date PE high of 22.5x going into its 4Q24 earnings announcement, it has de-rated to 17.6x following sell-offs from both its ‘disappointing’ earnings update and the market correction.
The market was disappointed that its cloud business grew less than expected (30% vs 35% expected) and also because its 2025 capex outlook was high ($75bn vs $60bn expected). However, crucially, cloud growth was only hampered by its cloud capacity rather than a lack of demand, which we take a positive as Alphabet will be able to convert this demand into sustainable high growth as it ramps up its capacity from its capex spend.
Due to this, we are buyers into this weakness, especially post-market correction. Furthermore, there were no material downwards earnings revisions and the company still offers a five-year EPS CAGR of ~15%, which is a compelling investment proposition at its current multiple, which is a 23% discount to its five-year average PE of 23x.

| Company Name | Reporting Grade | Result summary | 12 month forward EPS revisions | |
| last 30 days | last 90 days | |||
| Wilsons Global Equity Opportunities List - result summaries | ||||
| Tencent | Beat | Revenue and operating profit slightly beat expectations. Its core businesses Ad and Game are both performing well with mid-teens growth, with existing key Games titles showing strength. AI cloud revenue doubled and although it is only a small contributor, its large user base presents a compelling monetisation opportunity. | 1.3% | 1.3% |
| Apple | In line | Revenue was in line with expectations, while gross margin was above (46.9% vs 46.5% expected). However, meeting revenue expectations was driven by strong iPad and Mac sales as iPhone sales were slightly short of expectations ($69.1bn vs $70.7bn expected). | -0.2% | -1.0% |
| Adobe | Miss | While Q1 revenue and EPS were slightly ahead of expectations, its FY25 outlook was slightly short of consensus. In addition, investors are still waiting for the AI story to play out, with a new disclosure showing that AI-related ARR is $125m, which is still not yet material. | -0.2% | -0.1% |
| Amazon | Guidance miss | Q1 2025 guidance of +7% growth missed expectations of +11% and 2025 capex was guided to be $100bn (vs ~$90bn expected). Positively, Q4 2024 operating income was 12% ahead of consensus, its retail margins were stronger than expected and so was AWS growth (+19% vs +18% expected). | 0.3% | 2.3% |
| Salesforce | Guidance miss | Revenue growth guidance of +7-8% and subscription revenue growth of +9% slightly missed expectations. However, guidance may have been conservative given an uncertain macro outlook and a new CFO. While still small, AI revenue growth was strong, which is expected to become more material over time. | -0.3% | 0.0% |
| Disney | Beat | Revenue growth of +5% was in line with expectations, while operating income growth of +31% significantly beat expectations of +15%. Management maintained FY25 guidance of high single-digit EPS growth (consensus +8%). Growth is expected to accelerate from ramping DTC profitability. | 0.0% | 1.5% |
| Alphabet | Miss | Q4 Cloud revenue increased +30% year-on-year, short of expectations of +35%. Furthermore, 2025 capex was guided to $75bn was materially higher than expected ($60bn). Positively, Search and YouTube results came in ahead of expectations. | -0.2% | -0.4% |
| Home Depot | Guidance miss | This was a solid result in a challenging macro environment. Comp growth of +0.8% exceeded expectations of -1.7%, with US growth increasing +1.3%, suggesting market share gains. However, FY25 comp guidance (+1% vs +1.6%) and adjusted operating margin (13.4% vs 13.8%) was slightly short of expectations. | -3.2% | -3.3% |
| Intuitive Surgical | Beat/Upgrade | Solid beat across the board. Worldwide procedure volume increased +18% (vs 17% expected), while its guidance of 13-16% appears conservative given momentum in system placements. System placements was ahead of expectations (493 vs 445). Operating margin of 38% significantly beat expectations of 34%. | 0.0% | 2.3% |
| Johnson & Johnson | In line | An in line result with sales growth acceleration in MedTech with strong double-digit sales growth of key Innovative Medicines products. Although its electrophysiology business decelerated, other segments (i.e. Vision Care) performed strongly, demonstrating J&Js to drive growth with a strong, diversified portfolio. | 0.0% | -0.2% |
| Eli Lilly | Beat | In line result but 2025 guidance for revenue to increase +31% to $58-61bn and operating margins of 41.5-43.5% were ahead of consensus. LLY is set to benefit from its investment to increase capacity to meet strong demand as well as pipeline news in 2025. | 0.4% | 1.9% |
| Mastercard | Beat | Q4 results were ahead of expectations, with purchase volumes +13% YoY (constant currency [cc]), driven by acceleration from in each of cross-border, US and International volumes, as well as strong pricing. FY25 guidance of low double digit to low teens demonstrates MA's ability to compound growth despite its size. | 0.0% | -2.6% |
| Microsoft | Guidance miss | In line result but Q3 guidance for Azure (cloud) for +31-32% YoY growth was short of expectations of 33.5%. Management have cited sales execution and an unbalanced focus on AI growth led to disappointing non-AI growth. However, AI growth was strong. Furthermore, margin guidance was upgraded due to cost controls. | 0.0% | 0.7% |
| NVIDIA | Beat | Q4 revenue of $39.3bn was 3% ahead of consensus, while Q1 guidance of $43 bn (+65% vs the pcp) was 2% ahead of consensus, driven by a ramp in sales of its next-gen AI chip, Blackwell. However, gross margin guidance of 71% was short of expectations (71.8%), with its margin dipping due to the Blackwell ramp. | 3.1% | 2.1% |
| L'Oréal | Miss | Q4 LFL sales growth of +2.5% was short of expectations of +3.9%. However, in FY24, L'Oréal grew above system, implying market share gains. In its 2025 outlook, management flagged caution around sluggish demand in China but expects a gradual acceleration in sales, supported by new product launches. | -0.5% | 0.2% |
| Roche | Beat | Q4 sales was ahead of consensus, driven by the performance of Pharma, while core EBIT was in line. FY25 sales and EPS guidance was slightly ahead of expectations. The focus in FY25 will be its numerous (12) trial readouts which will be catalysts for the stock. | -0.6% | 0.8% |
| Schneider Electric | Beat/Upgrade | Schneider Electric's revenue and adjusted EBITDA 5% was ahead of consensus, with Energy Management and Automation performing well. 2025 guidance for organic revenue growth of +7-10% (midpoint +8.5% vs consensus +7.9%) and operating margin of 19.2-19.5% (midpoint 19.35% vs consensus 18.8%) was also strong. | 1.1% | 1.5% |
| Thermo Fisher Scientific | Beat | Revenue increased +4% to $11.4bn, slightly ahead of expectations ($11.29bn), with the beat driven by Analytical Instruments growth of ~8%. 2025 guidance of 3-4% organic growth was in line with consensus and ahead of system growth, showing continued share gains. | 0.2% | -0.1% |
| Walmart | Guidance miss | While Walmart's Q4 result was solid with its retail business continuing its momentum, it issued conservative guidance against high expectations, with FY26 net sales growth of +3-4% (consensus +5.1%) and operating income growth of +3.5-5.5% (consensus +8.6%). We note in FY24, WMT upgraded its initial conservative guidance. | -0.6% | -4.8% |
Source: Visible Alpha, Wilsons Advisory.
| Company Name | PE 12 mth fwd | EPS CAGR % (FY1-FY3) | Investment Summary |
| Information Technology | |||
| Adobe | 18.6 | 12% | Dominant digital media and marketing software business with a comprehensive suite of industry leading software products, a strong network effect and high switching costs. |
| Apple | 28.5 | 11% | World leader in the design and manufacture of high-quality mobile devices and PCs. Apple benefits from its scale, significant brand equity and high switching costs, and has a proven track record of innovating and growing its ecosystem. |
| Mastercard | 32.8 | 17% | Dominant #2 player (after Visa) in the global card payments industry which is a functioning duopoly. Significant competitive advantages include its vast network effect, its large scale, strong brand, innovative tech and the significant regulatory barriers to entry. |
| Microsoft | 27.1 | 16% | Leading maker of enterprise and consumer software. Enjoys a wide moat from its high switching costs and the widespread use and close integration between the products in its network. Growth will be driven by the cloud business as Azure scales up rapidly. |
| NVIDIA | 25.7 | 20% | World leader in the design and manufacturing of semiconductors used for graphics and other computationally intensive workloads. Continued growth will be driven by the increased need for computing power to support rapid technological advancement. |
| Salesforce | 25.1 | 14% | Salesforce is a pioneer in SaaS and a global leader in CRM technology. The business continues to gain share as it builds out its suite of integrated products and platforms, while the industry is growing at ~20% p.a. as the world becomes more digital. |
| Healthcare | |||
| Eli Lilly | 35.0 | 26% | Global pharma leader with a market leading position in GLP-1 weight loss drugs. The increasing penetration of GLP-1 drugs globally will drive significant earnings growth for LLY over the medium and long-term. |
| Intuitive Surgical | 60.6 | 17% | World leader in the manufacture of robot assisted surgery systems, with an entrenched market position and an extensive IP portfolio. Future earnings will be driven by overall organic growth in surgical procedures and rising penetration of robotic surgery. |
| Johnson & Johnson | 15.2 | 5% | A dominant global healthcare player with a range of products across consumer healthcare, medical devices, and diagnostics & pharmaceuticals. The largest division is pharmaceuticals, which has a number of products in the pipeline to drive medium-term growth. |
| Roche | 14.4 | 6% | Roche is a global pharmaceutical leader that produces prescription drugs in the areas of oncology, immunology and infectious diseases. The company’s R&D focus positions it to transform its extensive knowledge of disease biology into new treatments, providing significant growth potential if upcoming pipeline candidates are successful. |
| Thermo Fisher Scientific | 21.7 | 12% | #1 life sciences company in the world by some margin, with a relatively balanced exposure to the pharmaceutical, diagnostics, industrial, and academic end-markets. Has benefitted from the strong ongoing tailwinds driving increase pharmaceutical and biotech R&D spending. |
| Communication Services | |||
| Alphabet | 18.1 | 14% | Google has a very wide moat giving rise to its place as the overwhelmingly dominant leader in search. The business is still in the middle stages of the structural transition to digital advertising globally. Long-term growth will also be driven by its cloud and hardware businesses. |
| Disney | 17.2 | 13% | Global integrated entertainment business with a great portfolio of businesses centred on its streaming operations (i.e. Disney +, Hulu, ESPN+), as well as its cable networks and its strong mix of film studios. Key moats include its brand, scale and extensive IP. |
| Tencent | 17.9 | 11% | Chinese internet giant with an ever-expanding ecosystem that provides key services in social networking, gaming, media and entertainment, payments and cloud computing. Tencent benefits from its network effects, customer lock in, and significant IP. |
| Consumer Discretionary | |||
| Home Depot | 23.8 | 9% | The world's largest home improvement retailer. Over the medium-term, strong earnings growth should be underpinned by continued market share gains and looming US interest rate cuts. |
| Amazon | 30.6 | 22% | Amazon is the world's dominant player in both ecommerce and cloud infrastructure services (via AWS), which should continue to deliver significant long-term structural growth opportunities for the business - particularly in cloud. |
| Consumer Staples | |||
| L'Oréal | 25.8 | 8% | L’Oréal is the world's preeminent beauty player, with exposure to a range of categories (skin care, makeup, hair and perfume) and channels (mass, prestige, salon and pharmacy) and a proven track record of growing both organically and via acquisitions. |
| Walmart | 32.7 | 13% | Walmart is the largest retailer in the world with a focus on price leadership and convenience. After years of investments into its physical/digital assets, the business is positioned to win an ever-larger share of US consumer spending, with higher sales leveraged across the company’s asset base likely to benefit margins over time. |
| Industrials | |||
| Schneider Electric | 23.7 | 14% | World leading electrical equipment company with exposure to significant structural growth tailwinds from the Decarbonisation and Artificial Intelligence thematics. |
Source: Refinitiv, Wilsons Advisory.

Written by
Greg Burke, Equity Strategist
Greg is an Equity Strategist in the Investment Strategy team at Wilsons Advisory. He is the lead portfolio manager of the Wilsons Advisory Australian Equity Focus Portfolio and is responsible for the ongoing management of the Global Equity Opportunities List.
About Wilsons Advisory: Wilsons Advisory is a financial advisory firm focused on delivering strategic and investment advice for people with ambition – whether they be a private investor, corporate, fund manager or global institution. Its client-first, whole of firm approach allows Wilsons Advisory to partner with clients for the long-term and provide the wide range of financial and advisory services they may require throughout their financial future. Wilsons Advisory is staff-owned and has offices across Australia.
Disclaimer: This communication has been prepared by Wilsons Advisory and Stockbroking Limited (ACN 010 529 665; AFSL 238375) and/or Wilsons Corporate Finance Limited (ACN 057 547 323; AFSL 238383) (collectively “Wilsons Advisory”). It is being supplied to you solely for your information and no action should be taken on the basis of or in reliance on this communication. To the extent that any information prepared by Wilsons Advisory contains a financial product advice, it is general advice only and has been prepared by Wilsons Advisory without reference to your objectives, financial situation or needs. You should consider the appropriateness of the advice in light of your own objectives, financial situation and needs before following or relying on the advice. You should also obtain a copy of, and consider, any relevant disclosure document before making any decision to acquire or dispose of a financial product. Wilsons Advisory's Financial Services Guide is available at wilsonsadvisory.com.au/disclosures.
All investments carry risk. Different investment strategies can carry different levels of risk, depending on the assets that make up that strategy. The value of investments and the level of returns will vary. Future returns may differ from past returns and past performance is not a reliable guide to future performance. On that basis, any advice should not be relied on to make any investment decisions without first consulting with your financial adviser. If you do not currently have an adviser, please contact us and we would be happy to connect you with a Wilsons Advisory representative.
To the extent that any specific documents or products are referred to, please also ensure that you obtain the relevant disclosure documents such as Product Disclosure Statement(s), Prospectus(es) and Investment Program(s) before considering any related investments.
Wilsons Advisory and their associates may have received and may continue to receive fees from any company or companies referred to in this communication (the “Companies”) in relation to corporate advisory, underwriting or other professional investment services. Please see relevant Wilsons Advisory disclosures at www.wilsonsadvisory.com.au/disclosures.