The strength of the US tech sector and general hype with respect to the potential AI opportunities has raised the question of parallels to the dot com bubble boom of 1999-2000.
While we agree there are some cautionary parallels between then and now, we don’t find the same evidence of a broad-based bubble when we assess the current market picture relative to the early 2000s dot com bubble. We lay out our thinking below.
Valuations Full but Not Looking Like a Bubble
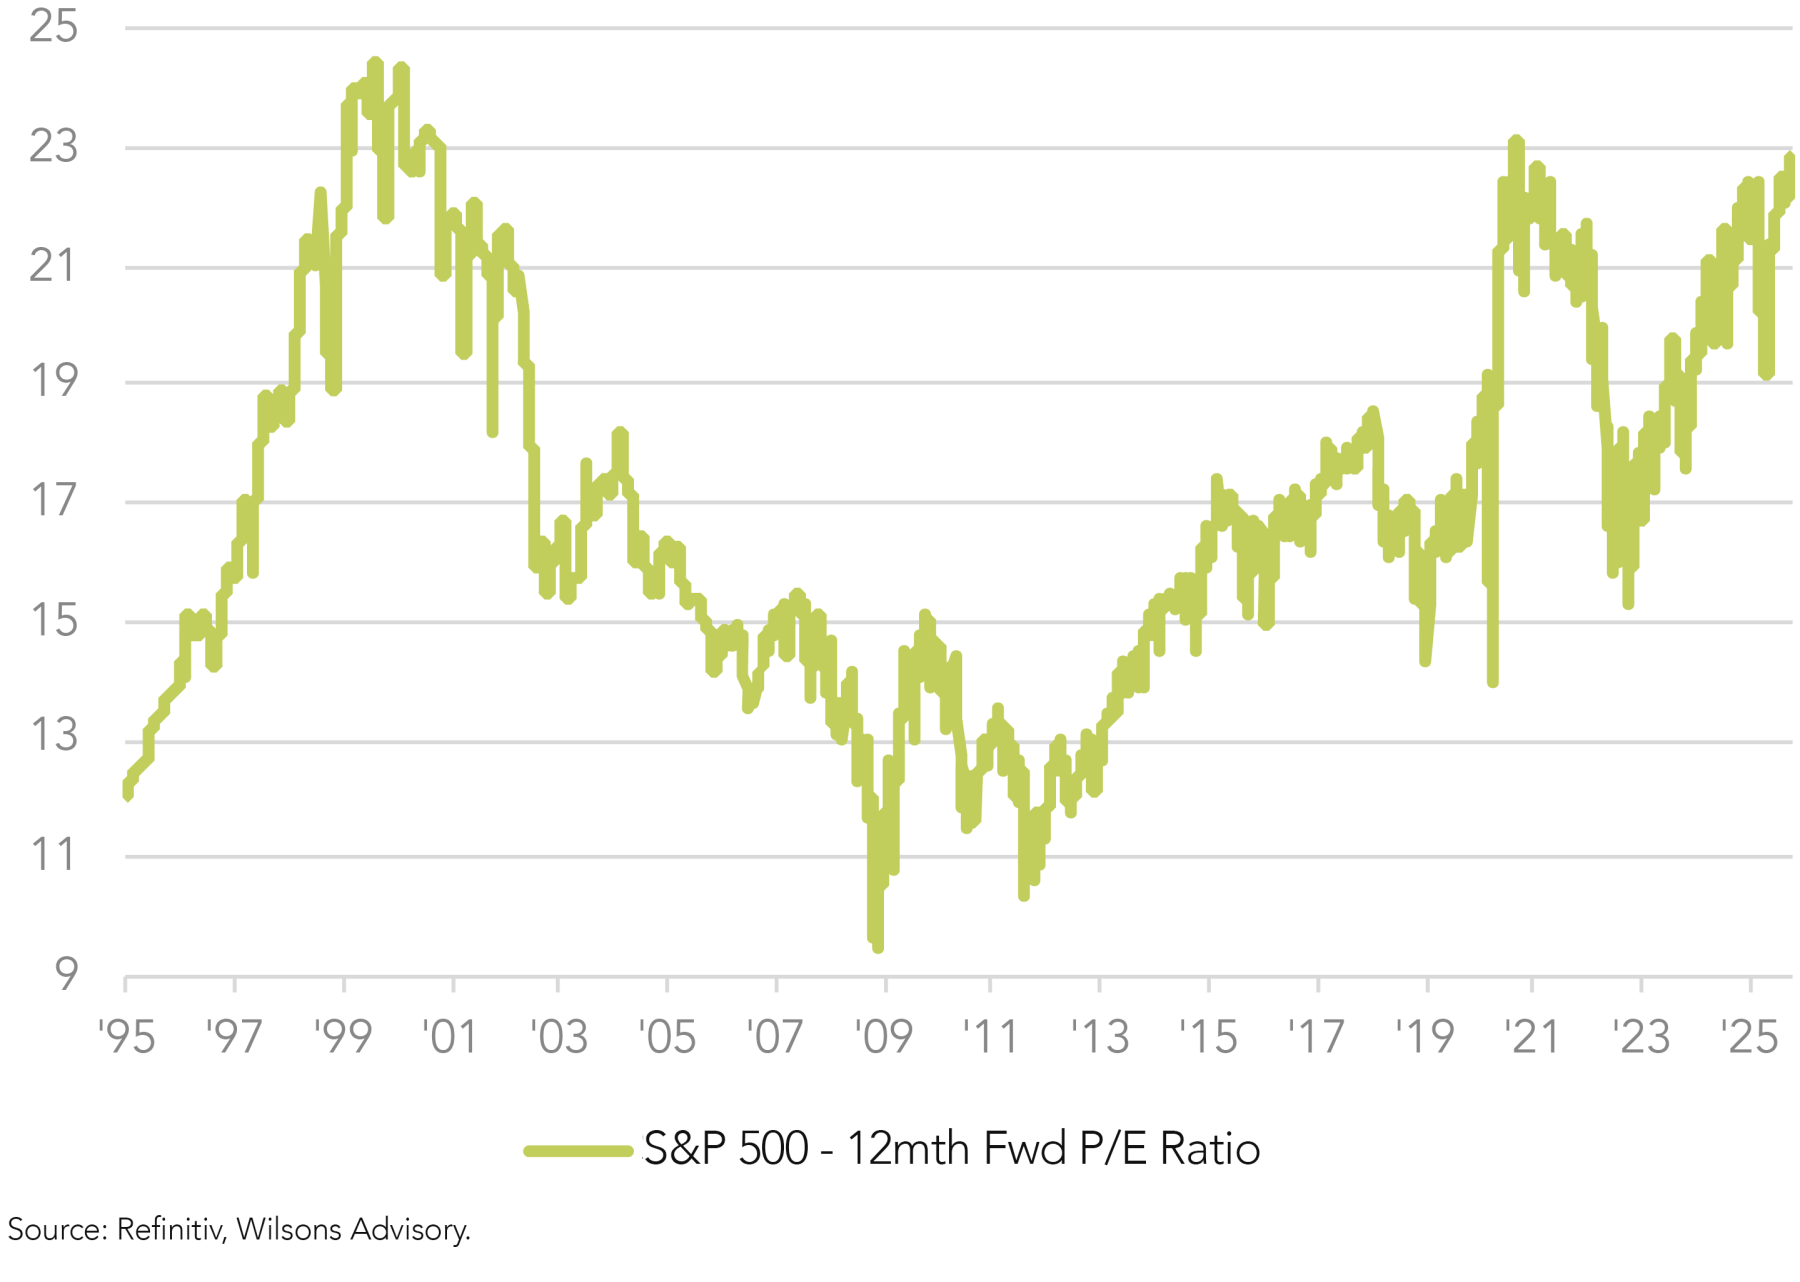
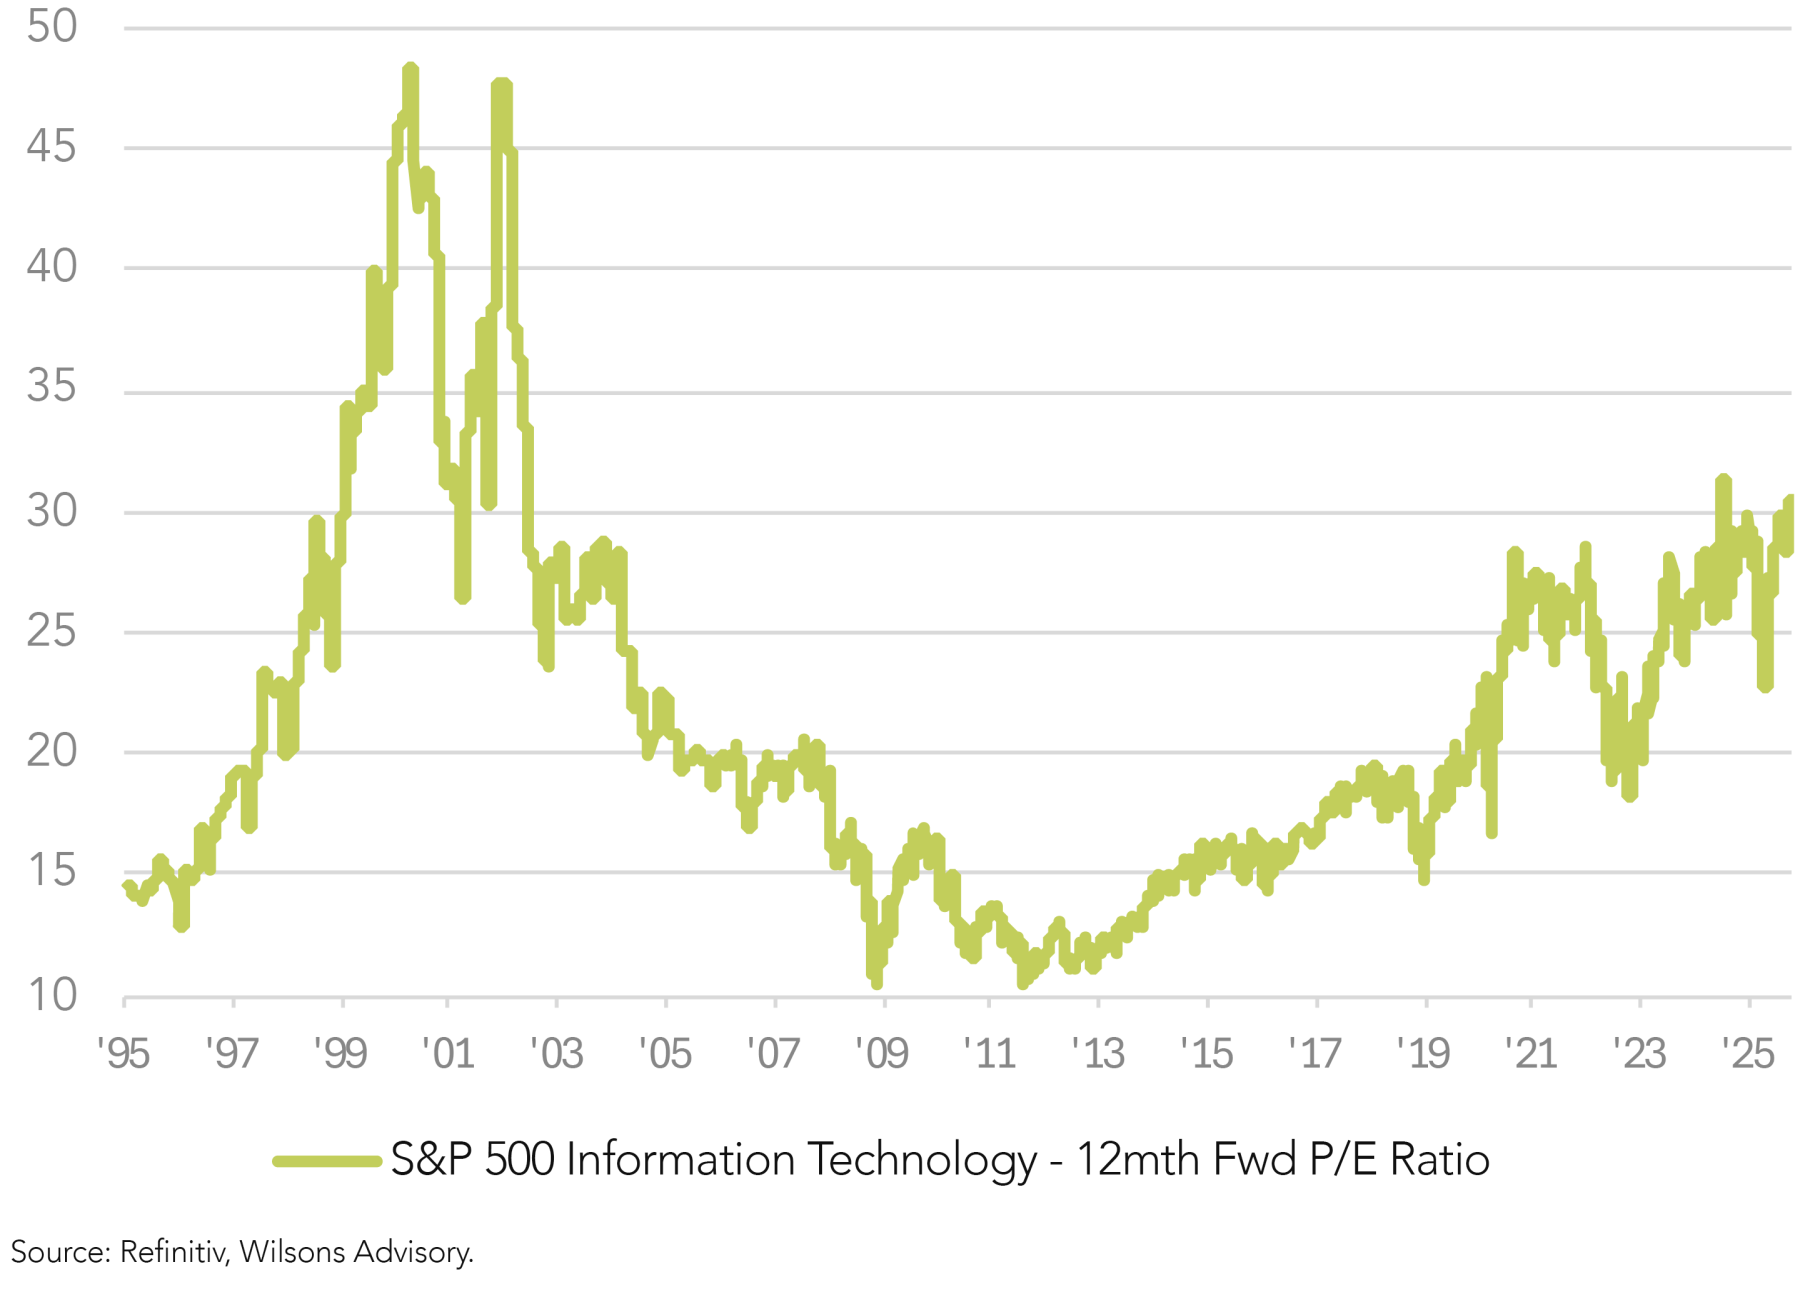
While valuations for the market and particularly for the tech sector have expanded well beyond simple long-term historical averages, neither the market, nor the tech sector, looks as stretched as the 2000 peak.
The aggregate S&P500 PE ratio currently stands at 23x. This compares to a peak valuation in the year 2000 of just under 25x.

While US valuations look full, they have been edging higher in a relatively controlled fashion. As result, the US market sits about 15% above its 5-year average valuation levels. Not cheap - but this compares to the peak in 2000 when the S&P500 sat 35% above its 5-year valuation levels after a mania-like expansion in multiples in 1999 and early 2000.
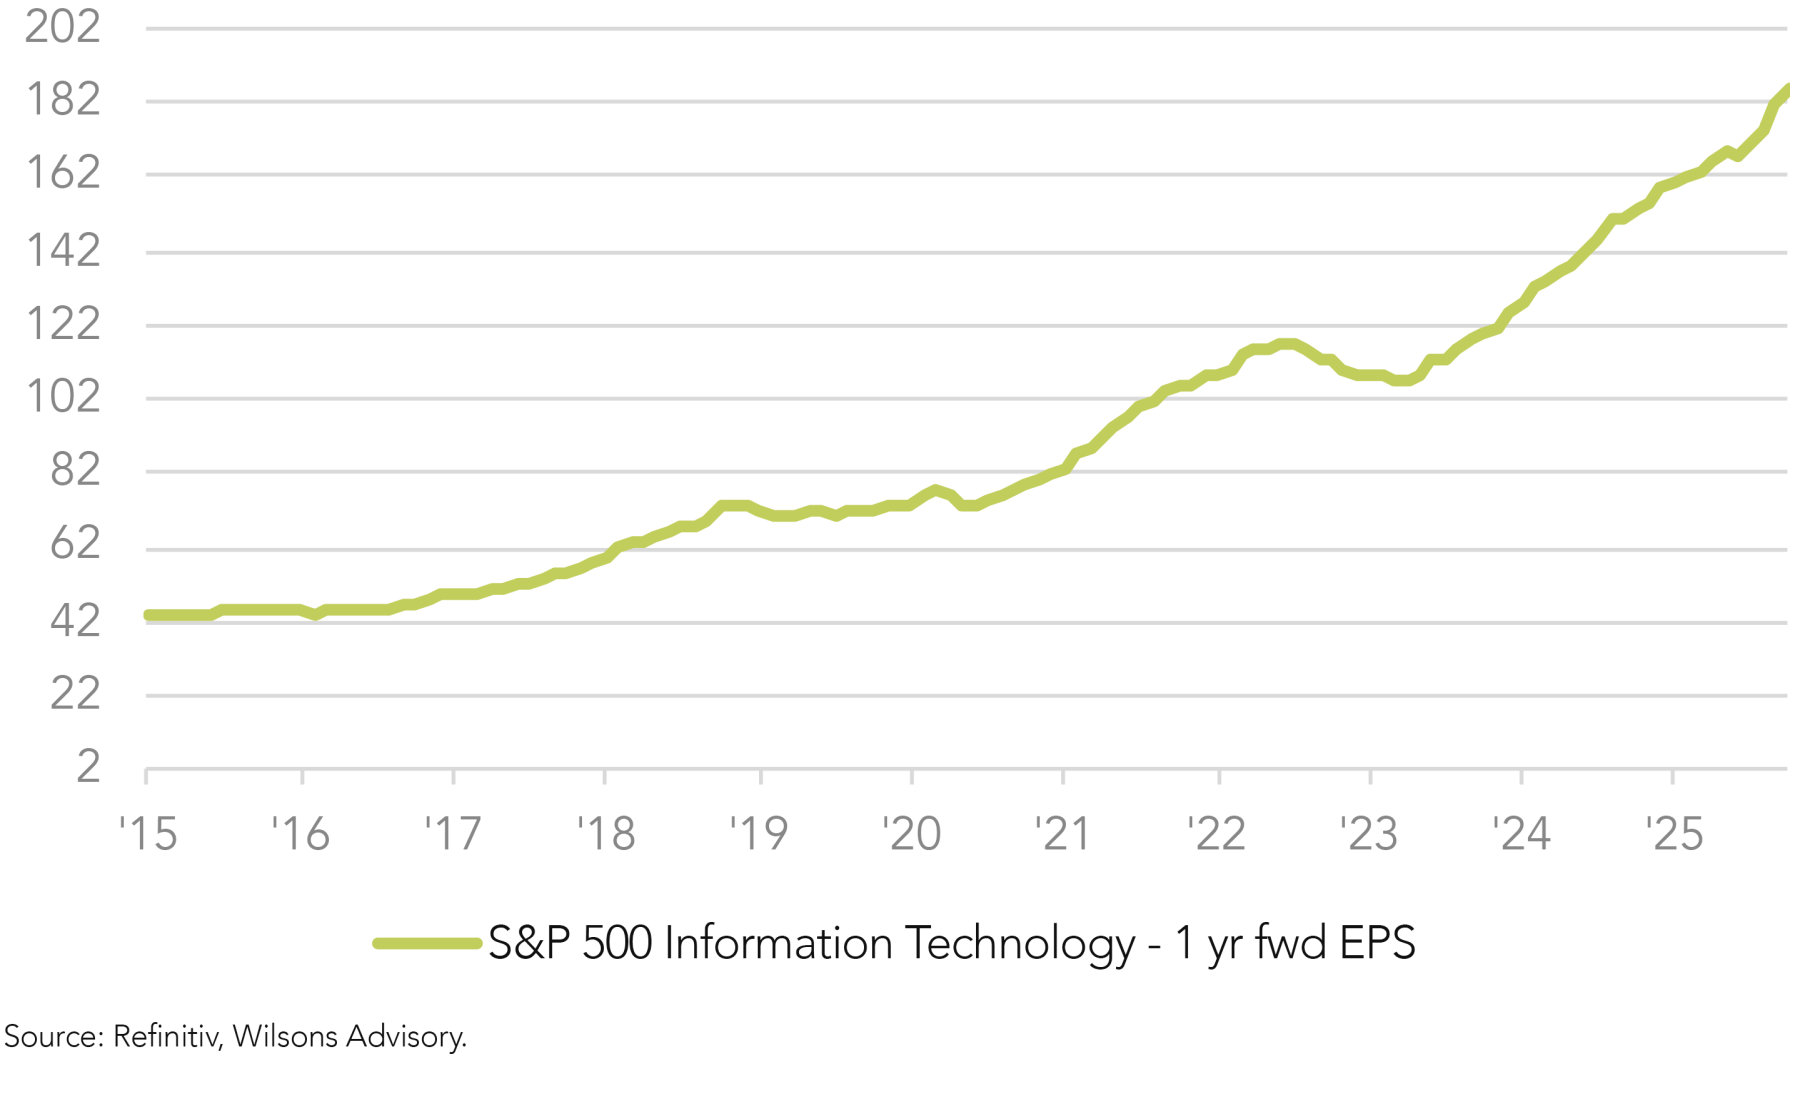
Looking at the tech sector specifically suggests current valuations are not nearly as stretched as in 2000. The US IT sector currently trades on 30x expected earnings (with current and expected growth of around 20%). This compares to a peak valuation of 49x in April 2000.

From a mega cap perspective, a comparison of the largest 10 stocks in the US market now versus in 2000 also suggest valuations are less stretched. figure 3 shows that many of the tech mega caps in 2000 were trading at multiples in excess of 50x - or indeed in excess of 100x earnings in some cases. At present, mega cap valuations don’t look cheap but many stocks are clustered around the 30x earnings level.
Profitability (ROE and net margin) measures also currently look stronger. For some commentators, this strong level of profitability is a bearish signal. However, we note that such views based on a “reversion” in US market profitability have been a constant refrain from many US market bears for over 10 years now.
| US $BN | % of S&P500 | P/E (12 Mth FWD EPS) | ROE Trailing | Net Margin | |
| Micrososft | 557 | 4% | 60 | 29% | 39% |
| Cisco systems | 533 | 4% | 133 | 22% | 20% |
| General Electric | 513 | 4% | 50 | 26% | 9% |
| Intel | 442 | 3% | 45 | 27% | 26% |
| Exxxon | 271 | 2% | 31 | 18% | 5% |
| Walmart | 252 | 2% | 45 | 23% | 3% |
| Oracle | 222 | 2% | 150 | 41% | 15% |
| IBM | 212 | 2% | 36 | 30% | 7% |
| Citigroup | 202 | 2% | 18 | 24% | 13% |
| Lucent | 196 | 2% | 77 | 20% | 9% |
Source: Refinitiv, Wilsons Advisory.
| US $BN | % of S&P500 | P/E (12 Mth FWD EPS) | ROE Trailing | Net Margin | |
| NVIDIA Corp | 4375 | 7% | 30 | 106% | 55% |
| Microsoft Corp | 3817 | 6% | 31 | 32% | 36% |
| Apple Inc | 3677 | 6% | 31 | 176% | 27% |
| Alphabet Inc | 2972 | 5% | 24 | 36% | 33% |
| Amazon.com Inc | 2308 | 4% | 29 | 26% | 11% |
| Meta Platforms Inc | 1780 | 3% | 24 | 37% | 38% |
| Broadcom Inc | 1625 | 3% | 38 | 32% | 35% |
| Tesla Inc | 1427 | 2% | 200 | 9% | 7% |
| Berkshire Hathaway | 1070 | 2% | 23 | 7% | 12% |
| Walmart Inc | 855 | 1% | 38 | 21% | 3% |
Source: Refinitiv, Wilsons Advisory.
Still Some Cautionary Parallels
However, we do note some cautionary comparisons to the 2000 peak.
Firstly, we note that “market concentration” is actually higher than in 2000. We proxy concentration by looking at the weight of the 10 largest stocks in the S&P500 now versus in 2000. The 10 largest stocks currently account for close to 40% of US market cap. This compares to a long-term average of 20% and a year 2000 peak of 27%.
This may not in itself be a strong bear signal. It is possible the current concentrated nature of the US market reflects the networking advantage of today’s dominant scale players, particularly in technology.
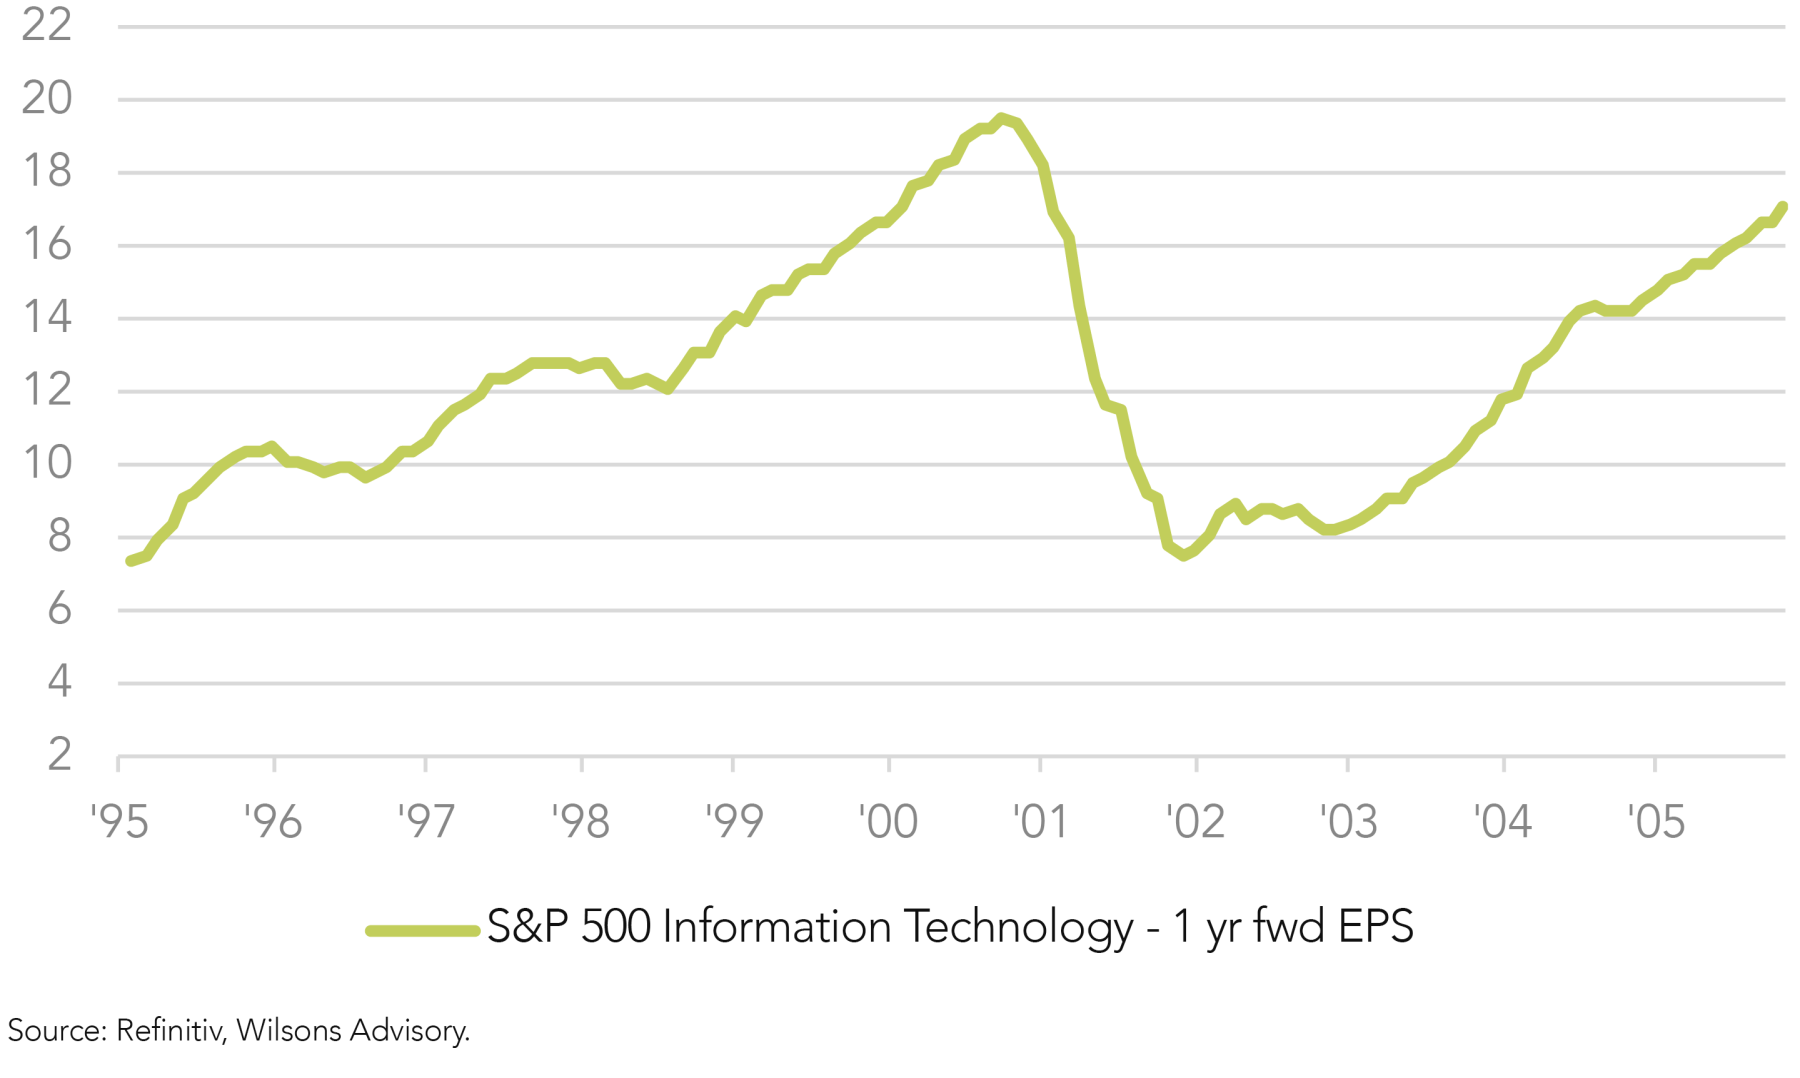
As we discussed last week, we do see it as somewhat cautionary that capex relative to revenue has accelerated in the tech sector. This broadly appears analogous to the 1999/00 period.
This acceleration in capital expenditure (mostly AI related) has seen a marked deterioration in free cash flows relative to accounting earnings. At present this is creating a virtuous circle of rising tech capex driving higher and higher tech “earnings” for the chip makers cloud data and other associated AI infrastructure providers. There is a risk that a significant capex unwind at some point sends tech sector revenues and profits into reverse, at least for a period.
Virtuous circles?
Another perhaps worrying parallel is the recent rise in “vendor finance deals” between the chip makers and the AI chip users, which looks similar to the telco internet infrastructure companies in the 1990/00 period
When Nvidia announces it is investing in OpenAI, which then uses that capital to buy Nvidia chips, it creates a closed loop that may not reflect real market demand. If one major player (customer) falters, the entire ecosystem could unwind - similar to how AOL, Sun Microsystems, and others collapsed post-2000. In 2000 Telcos like WorldCom, Global Crossing, and Nortel invested tens of billions in fibre optic networks, undersea cables, and switching infrastructure, anticipating exponential internet demand. Equipment vendors (e.g. Lucent, Cisco) often financed telcos to buy their equipment, creating closed-loop demand that inflated revenues and valuations.
While today’s tech giants have stronger fundamentals than their dot-com predecessors, the scale, speed, and interdependence of vendor finance arrangements in AI raise some concerns. The infrastructure and the profits flowing from it are real - but whether the demand will be sustainable enough to justify the investment remains uncertain.
Still Plenty of AI Hype Through the US Equity Market
Finally, while we believe the mega caps are priced plausibly, outside the mega caps there appears to be plenty of optimism priced in with regard to the potential of AI to drive future earnings growth. Indeed, outside of the highly profitable mega caps many AI “growth stocks” with low (high PEs) or no current profitability (infinite PE’s) have surged over the past 12 months, as was the case in the run up to the dot com peak.


Ultimately, we remain focused on both the earnings cycle and the monetary backdrop. The US tech sector still appears supported by strong earnings growth, while the Fed is providing monetary and liquidity support to the US economy and the equity market. We continue to watch for signs of inflection, but stay cautiously constructive albeit well diversified beyond just US tech.

Written by
David Cassidy, Head of Investment Strategy
David is one of Australia’s leading investment strategists.
About Wilsons Advisory: Wilsons Advisory is a financial advisory firm focused on delivering strategic and investment advice for people with ambition – whether they be a private investor, corporate, fund manager or global institution. Its client-first, whole of firm approach allows Wilsons Advisory to partner with clients for the long-term and provide the wide range of financial and advisory services they may require throughout their financial future. Wilsons Advisory is staff-owned and has offices across Australia.
Disclaimer: This communication has been prepared by Wilsons Advisory and Stockbroking Limited (ACN 010 529 665; AFSL 238375) and/or Wilsons Corporate Finance Limited (ACN 057 547 323; AFSL 238383) (collectively “Wilsons Advisory”). It is being supplied to you solely for your information and no action should be taken on the basis of or in reliance on this communication. To the extent that any information prepared by Wilsons Advisory contains a financial product advice, it is general advice only and has been prepared by Wilsons Advisory without reference to your objectives, financial situation or needs. You should consider the appropriateness of the advice in light of your own objectives, financial situation and needs before following or relying on the advice. You should also obtain a copy of, and consider, any relevant disclosure document before making any decision to acquire or dispose of a financial product. Wilsons Advisory's Financial Services Guide is available at wilsonsadvisory.com.au/disclosures.
All investments carry risk. Different investment strategies can carry different levels of risk, depending on the assets that make up that strategy. The value of investments and the level of returns will vary. Future returns may differ from past returns and past performance is not a reliable guide to future performance. On that basis, any advice should not be relied on to make any investment decisions without first consulting with your financial adviser. If you do not currently have an adviser, please contact us and we would be happy to connect you with a Wilsons Advisory representative.
To the extent that any specific documents or products are referred to, please also ensure that you obtain the relevant disclosure documents such as Product Disclosure Statement(s), Prospectus(es) and Investment Program(s) before considering any related investments.
Wilsons Advisory and their associates may have received and may continue to receive fees from any company or companies referred to in this communication (the “Companies”) in relation to corporate advisory, underwriting or other professional investment services. Please see relevant Wilsons Advisory disclosures at www.wilsonsadvisory.com.au/disclosures.
