
The Wilsons Advisory Global Equity Opportunities List harnesses research from our partner Craigs to highlight attractive investment ideas across global equity markets with a distinct focus on high quality, growth-oriented companies.
Our Approach to Global Investing
Long-term investment horizon
Buying shares in outstanding businesses and owning them for the long-term.
Quality focus
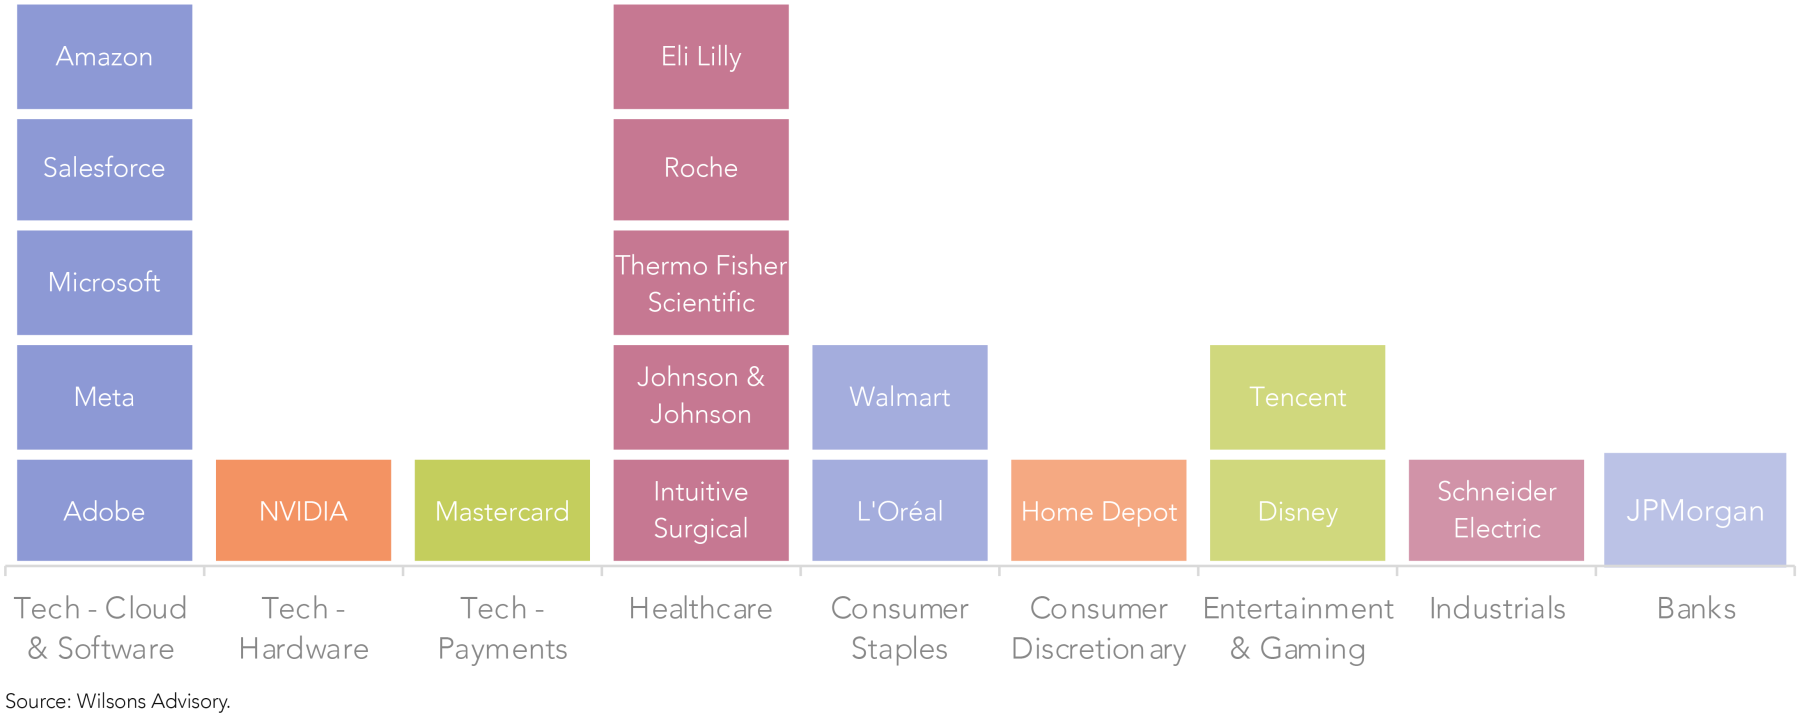
High quality businesses are those with a track record of generating returns on invested capital (ROIC) above their cost of capital over time. The focus of this strategy is on world-class franchises with high ROICs, strong management teams and durable competitive advantages underpinned by network effects (e.g. Mastercard), scale advantages (e.g. Walmart), switching costs (e.g. Microsoft), brand equity (e.g. L’Oréal) and intellectual property (e.g. Nvidia). In combination, these characteristics underpin strong and resilient cash flows through economic cycles.
Growth bias
The focus is on identifying companies that are likely to deliver above-market earnings growth over time. Over the long-term, earnings growth is the primary determinant of shareholder returns in our view. Therefore, the strategy is comfortable paying a (reasonable) premium for businesses with exceptional long-term growth potential noting the market often undervalues the long-term compounding ability of genuine secular growth opportunities in the short-run.
Structural growth thematics
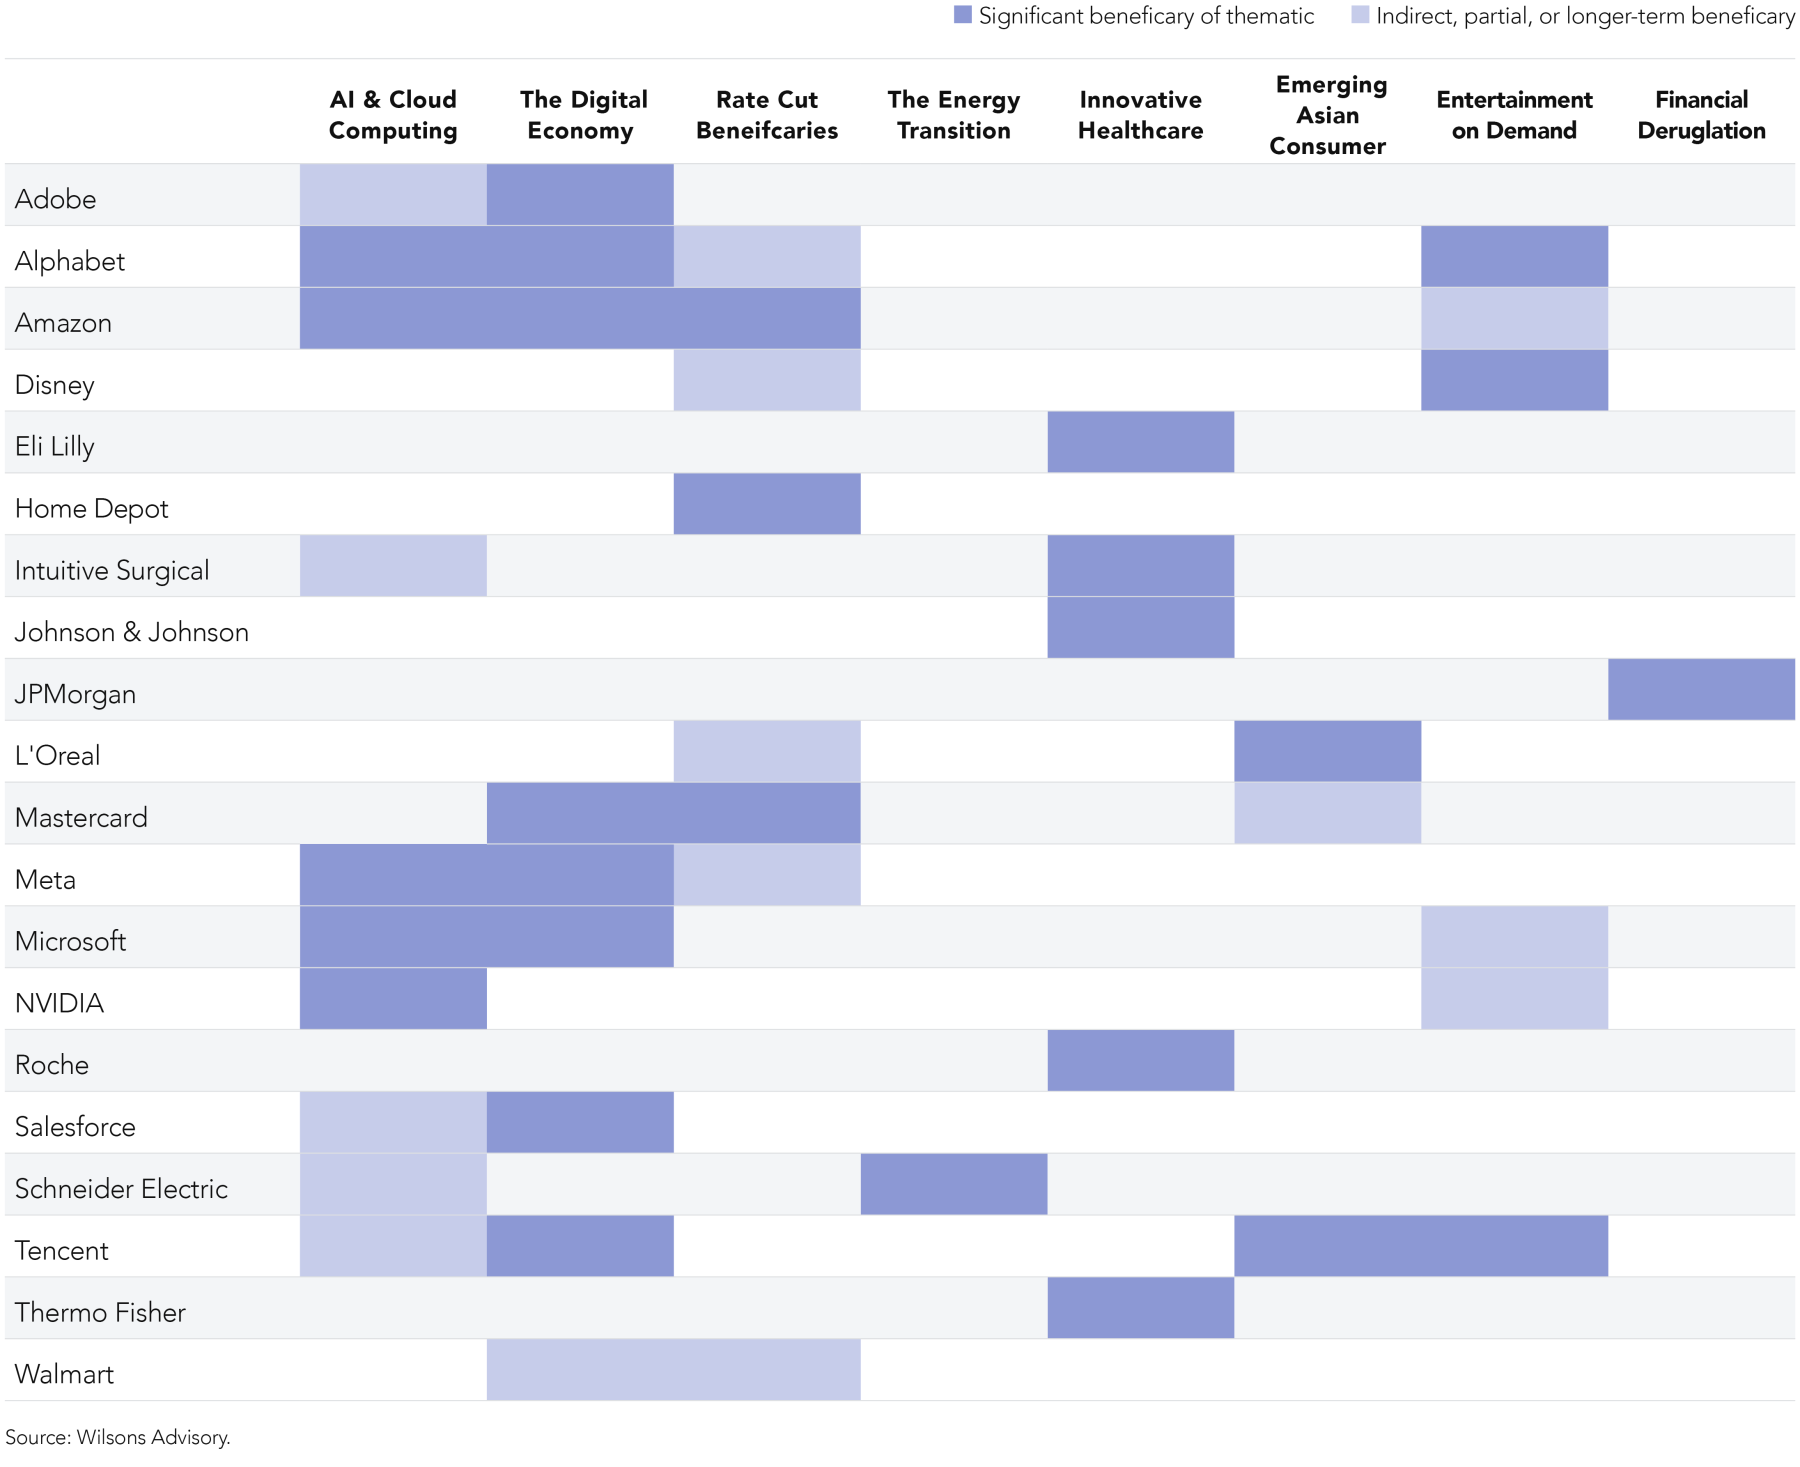
The strategy is exposed to a number of ‘megatrends’ that are expected to materially change the way society operates and should underpin significant long-term earnings growth over time for the companies leveraged to them, including:
- Cloud Transition - the structural transition of workloads onto the cloud, and exponential growth in the quantum of data created, is benefiting the major cloud service providers (i.e. Amazon, Microsoft, Alphabet,) and semi-conductor companies (i.e. NVIDIA).
- Artificial Intelligence – the most immediate beneficiaries of Generative AI are the semiconductor designers and cloud service providers, which provide the infrastructure that powers AI workloads. Several software companies have also integrated AI into their offerings, including Microsoft’s Co-pilot, Meta's Llama, Adobe's Firefly, and Salesforce’s Sales GPT.
- Innovative Healthcare – Pharmaceutical, lifescience, and medical technology companies are exposed to several secular tailwinds, including ageing populations and the rising prevalence of chronic disease, which are driving increased demand for healthcare. Scientific breakthroughs have also underpinned the creation of better drugs and treatment methods. The rapid growth in the use of GLP-1 drugs to treat weight loss is one such example. Eli Lily, Thermo Fisher, Roche, Intuitive Surgical, and Johnson & Johnson provide exposure to this thematic.
- Digital Economy - the ‘digitalization’ of information, commerce, payments, advertising, and work processes is providing structural tailwinds for a wide range of companies including Adobe, Salesforce, Alphabet, Amazon, Tencent, Apple, and Microsoft.
- Energy Transition – to achieve 'net zero', the amount of investment into energy infrastructure will need to rise substantially over the coming decades. The rollout of renewables represents a significant change to the electrical value chain which will require an expansion and modernisation of grid infrastructure, and such, will drive an upward inflexion in demand for Schneider Electric's products.
- Entertainment on Demand – the growing popularity of on-demand content and live online gaming is a tailwind for streaming providers like Disney (via Disney+, Hulu), Apple (i.e. Apple TV, Apple Music), Amazon (i.e. Amazon Prime, Twitch), Alphabet (i.e. YouTube), and digital gaming platforms like Microsoft’s Xbox.
- Emerging Asian Consumer –the Asian middle class is expected to grow by ~1.5 billion people between 2020-2030, which is creating a large consumer class driving structural growth in demand for goods like cosmetics (i.e. L’Oréal) as well as technology/social media (i.e. Tencent).
US Earnings Remain More Resilient Than Expected
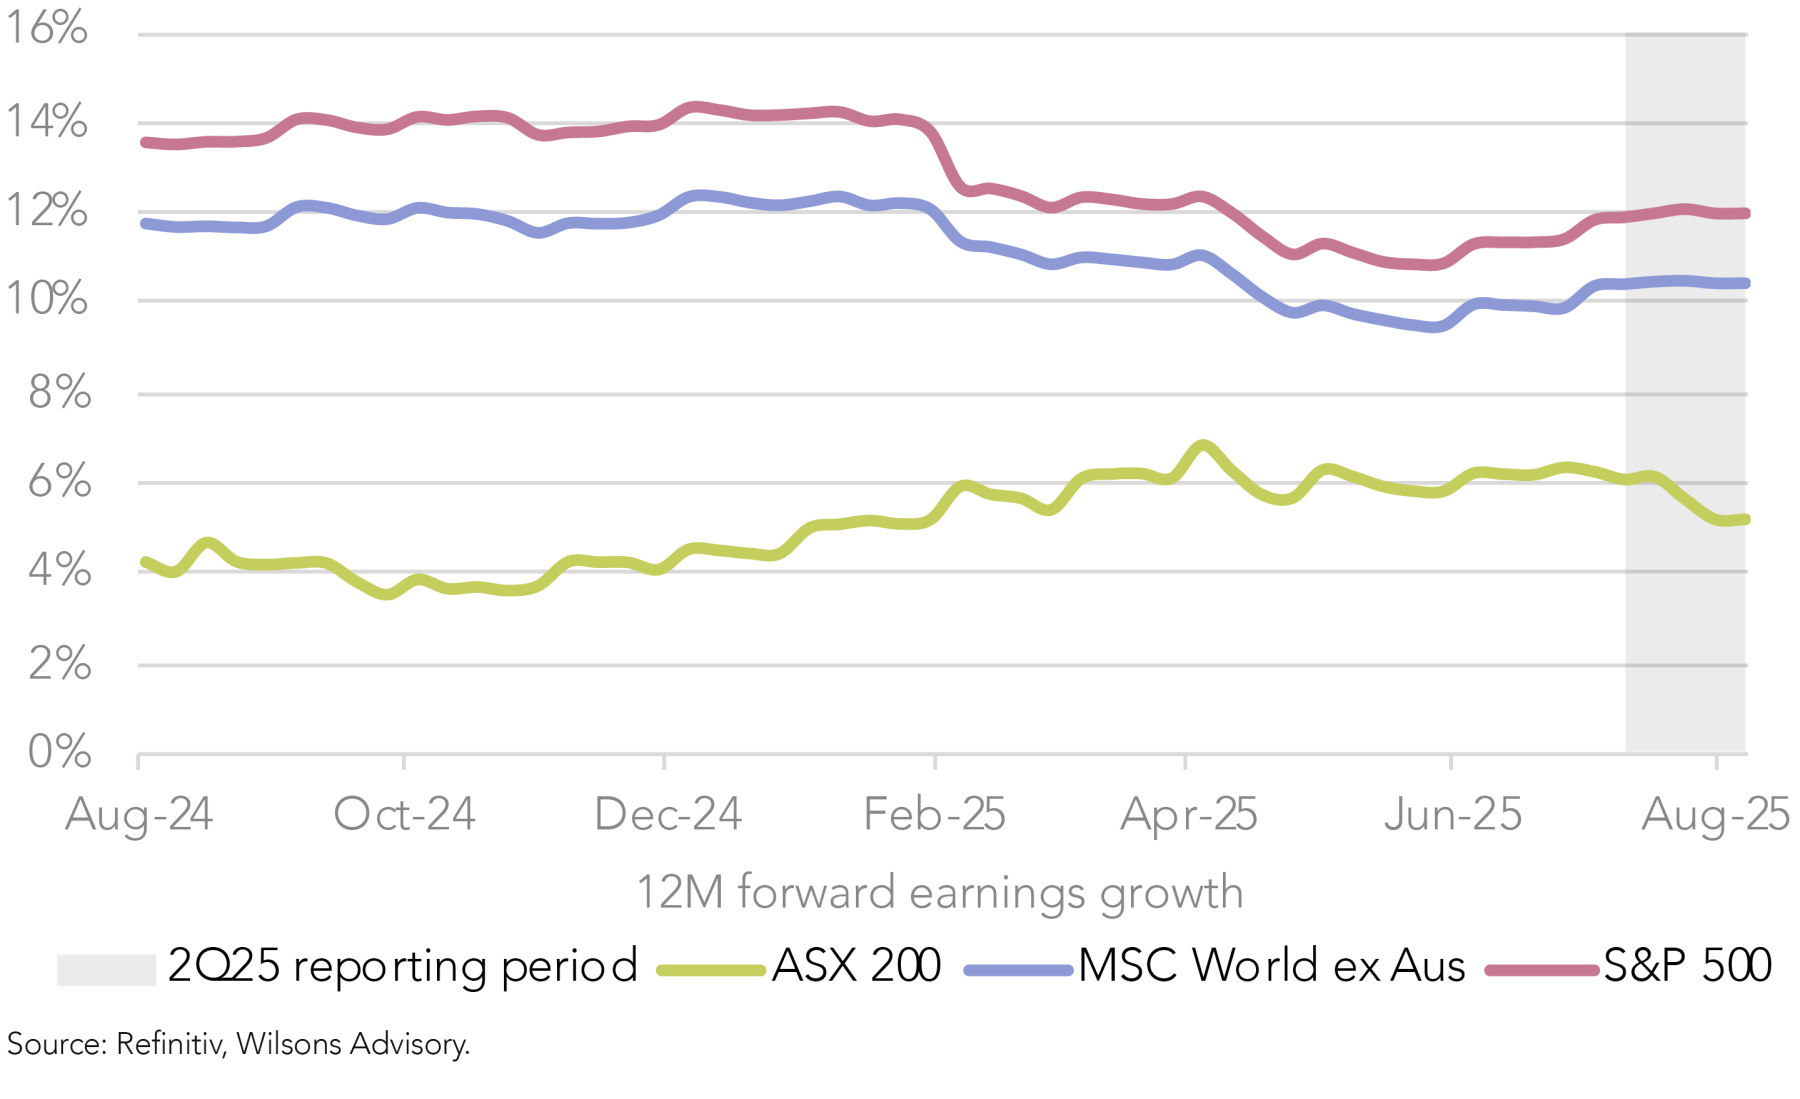
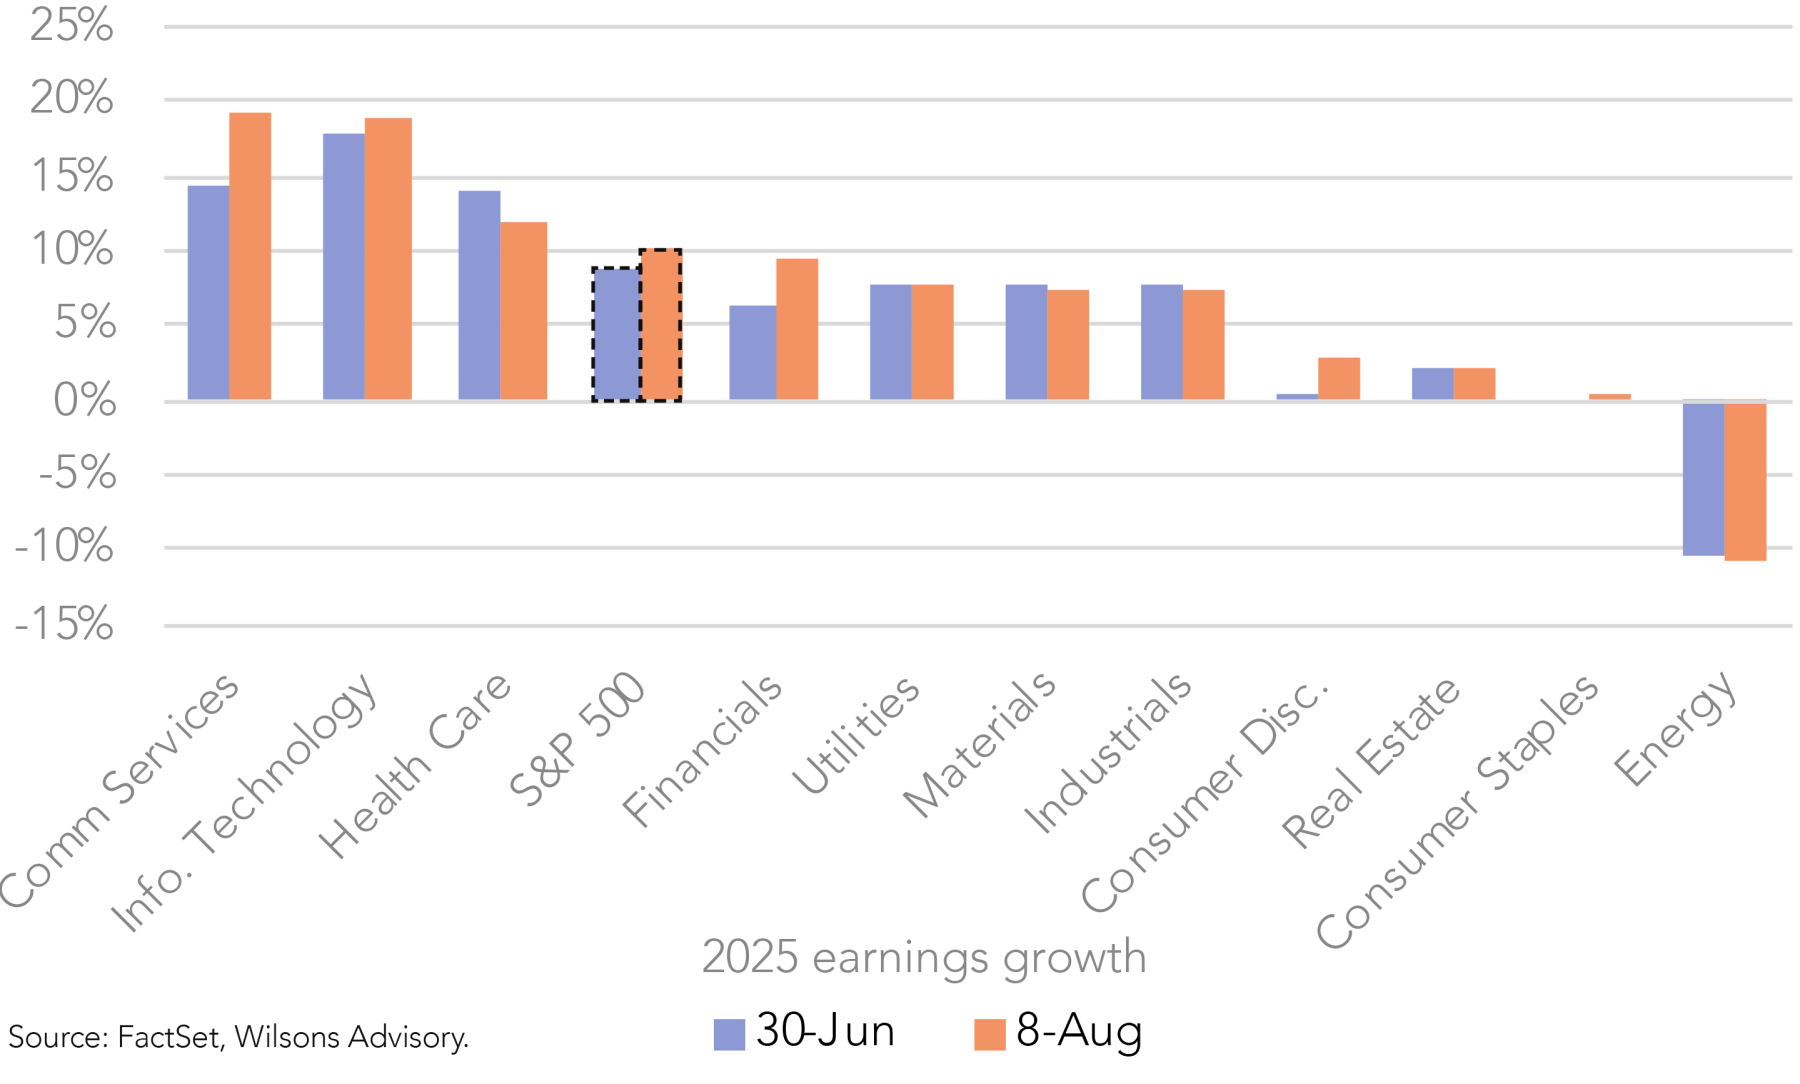
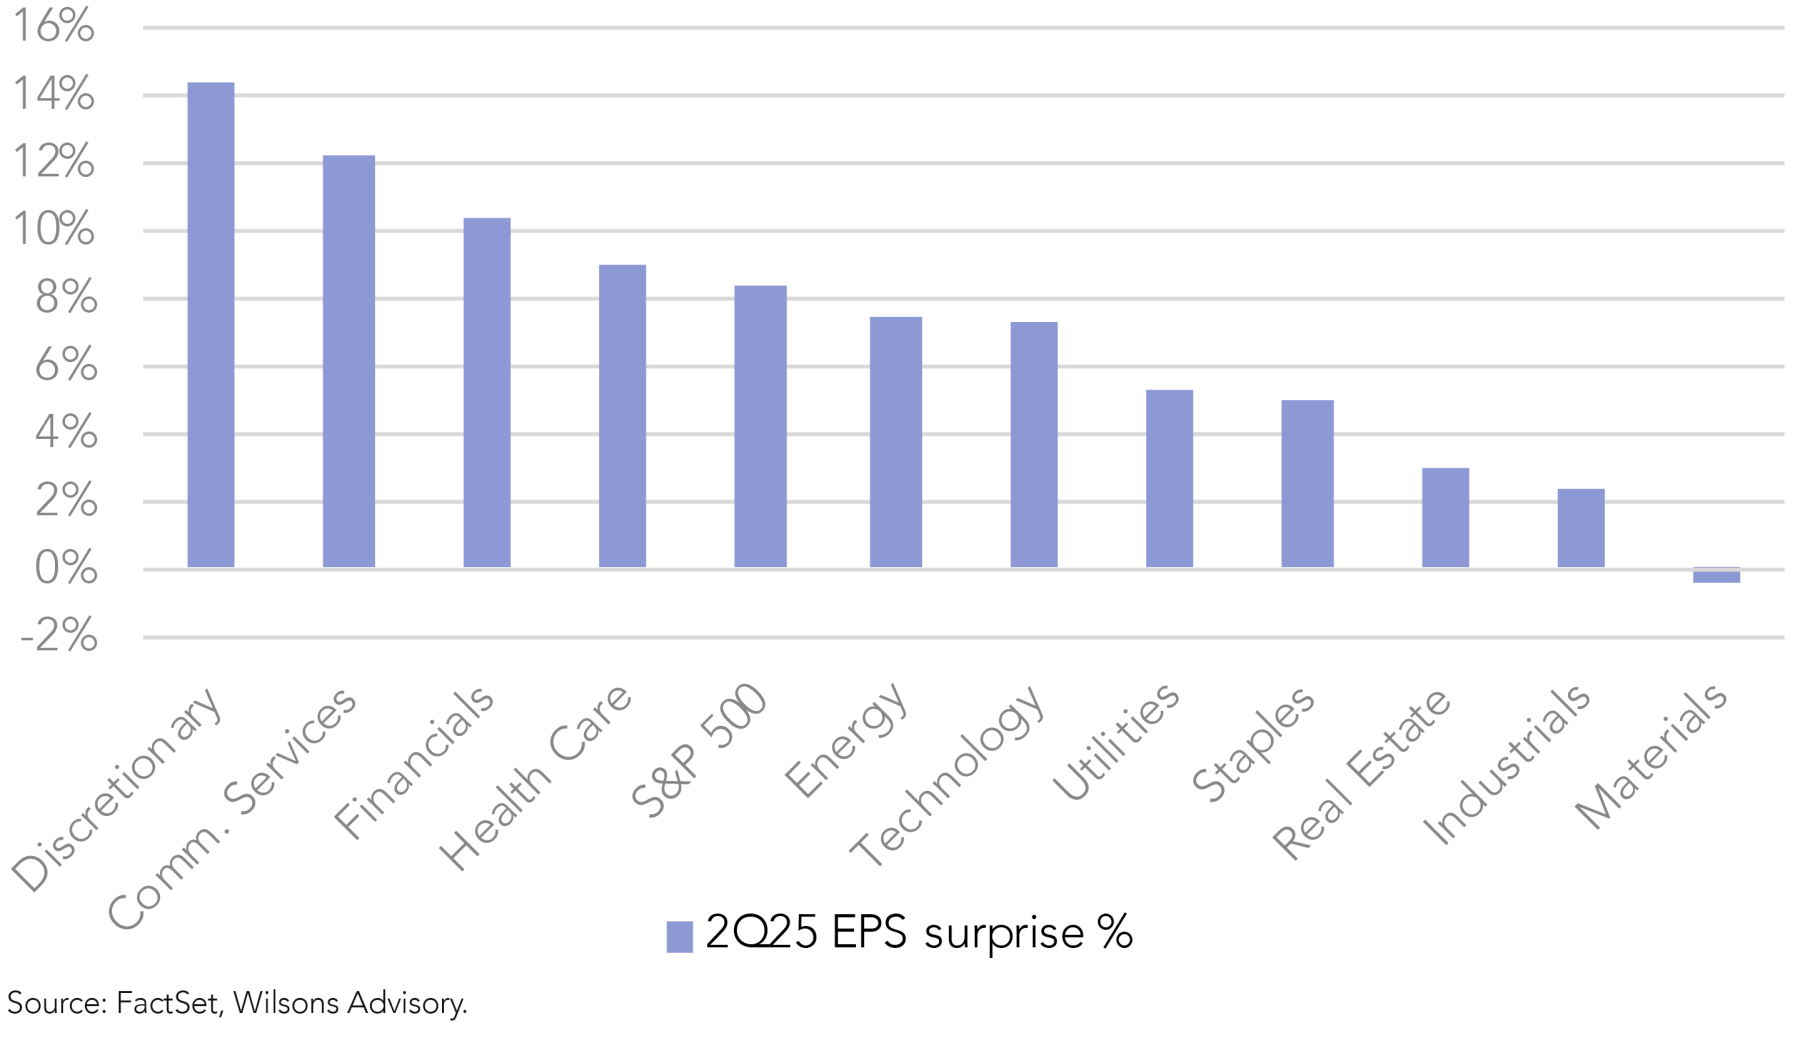
The Q2 2025 US reporting season is progressing with strong momentum, painting a constructive picture of US earnings. With ~90% of S&P 500 companies having reported, 81% have beat expectations, well above the 10-year average of 75%. This is highest beat rate since Q3 2021. The large number of earnings beats particularly from several index heavyweights, has resulted in Q2 2025 year-on-year (YoY) earnings growth being upgraded from 4.9% (immediately prior to earnings season) to 11.8%.
Magnificent 7’s impressive earnings has driven upgrades to the index
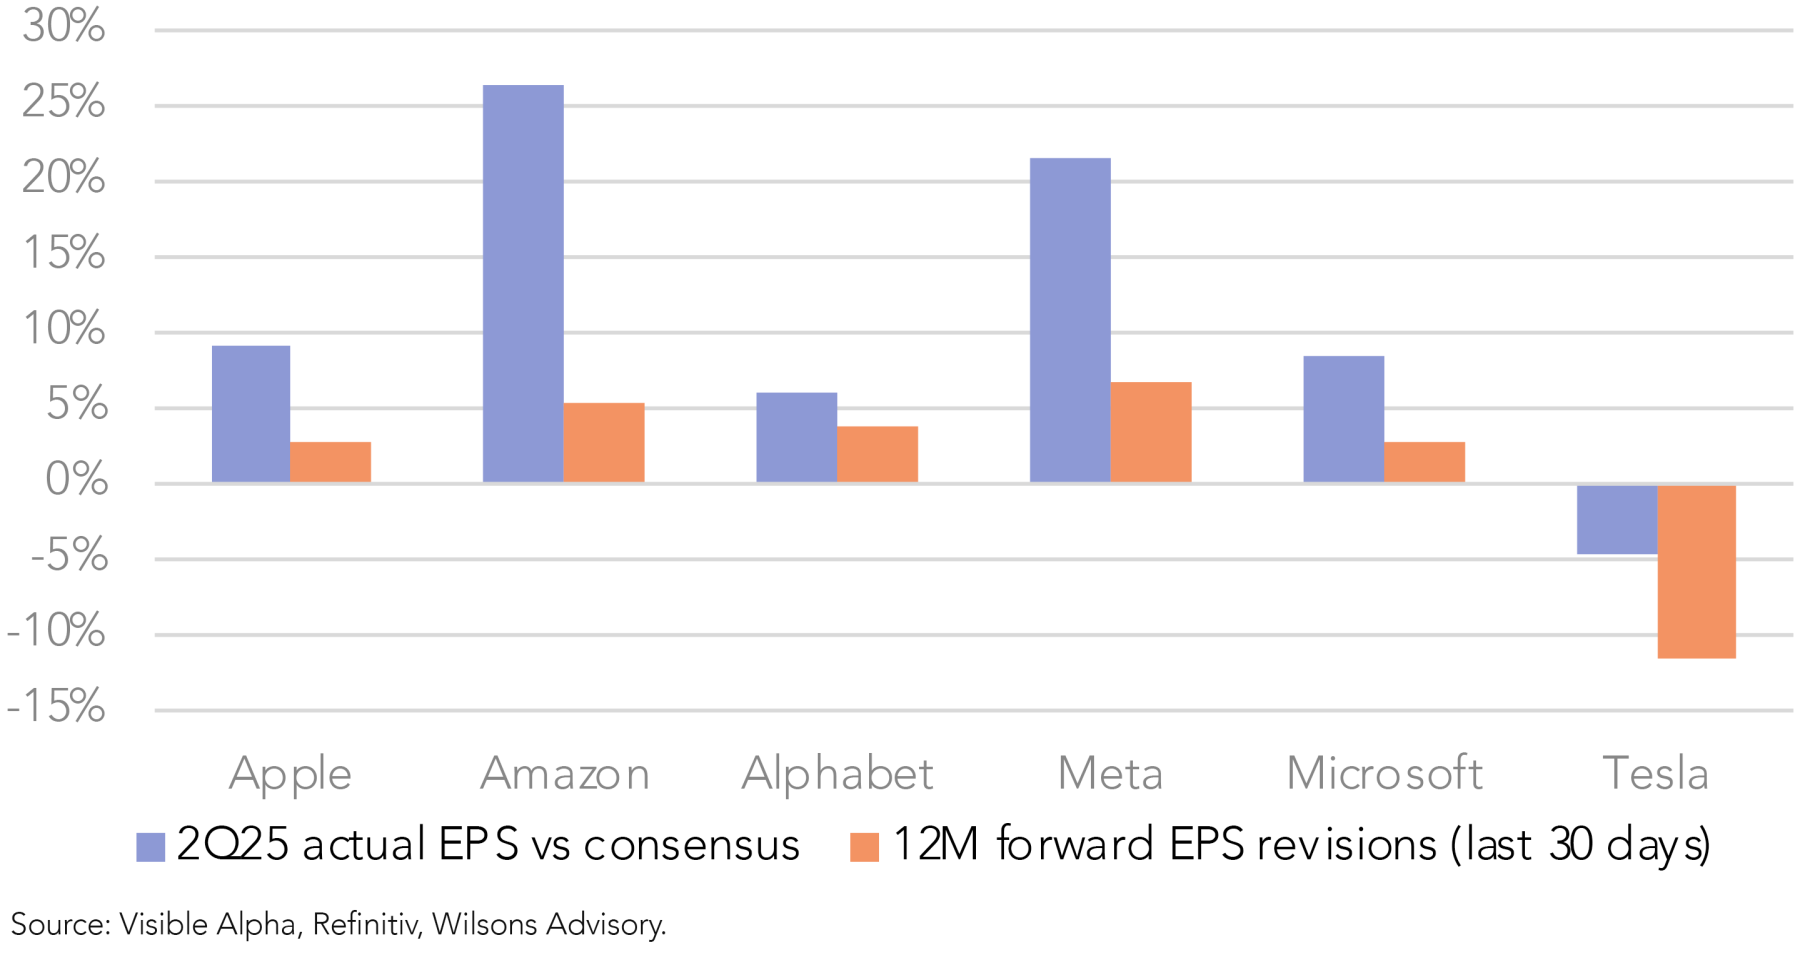
In particular, Magnificent 7 companies (excluding Tesla) have reported well, driving earnings upgrades. Apple ($1.57 vs $1.44 expected), Amazon ($1.68 vs $1.33 expected), Alphabet ($2.31 vs $2.18 expected), Meta Platforms ($7.14 vs $5.88 expected), and Microsoft ($3.65 vs $3.37 expected) all delivered notable EPS surprises, which has also led to forward EPS upgrades. Tesla was the exception among the group, delivering a slight earnings miss ($0.40 vs $0.42 expected) and cautious commentary on the outlook, resulting in EPS downgrades. Overall, the largely positive results of the Magnificent 7 have lifted full year 2025 earnings growth expectations from 8.9% to 10.3% since the start of the season.
Communications and Financials have seen the biggest upgrades
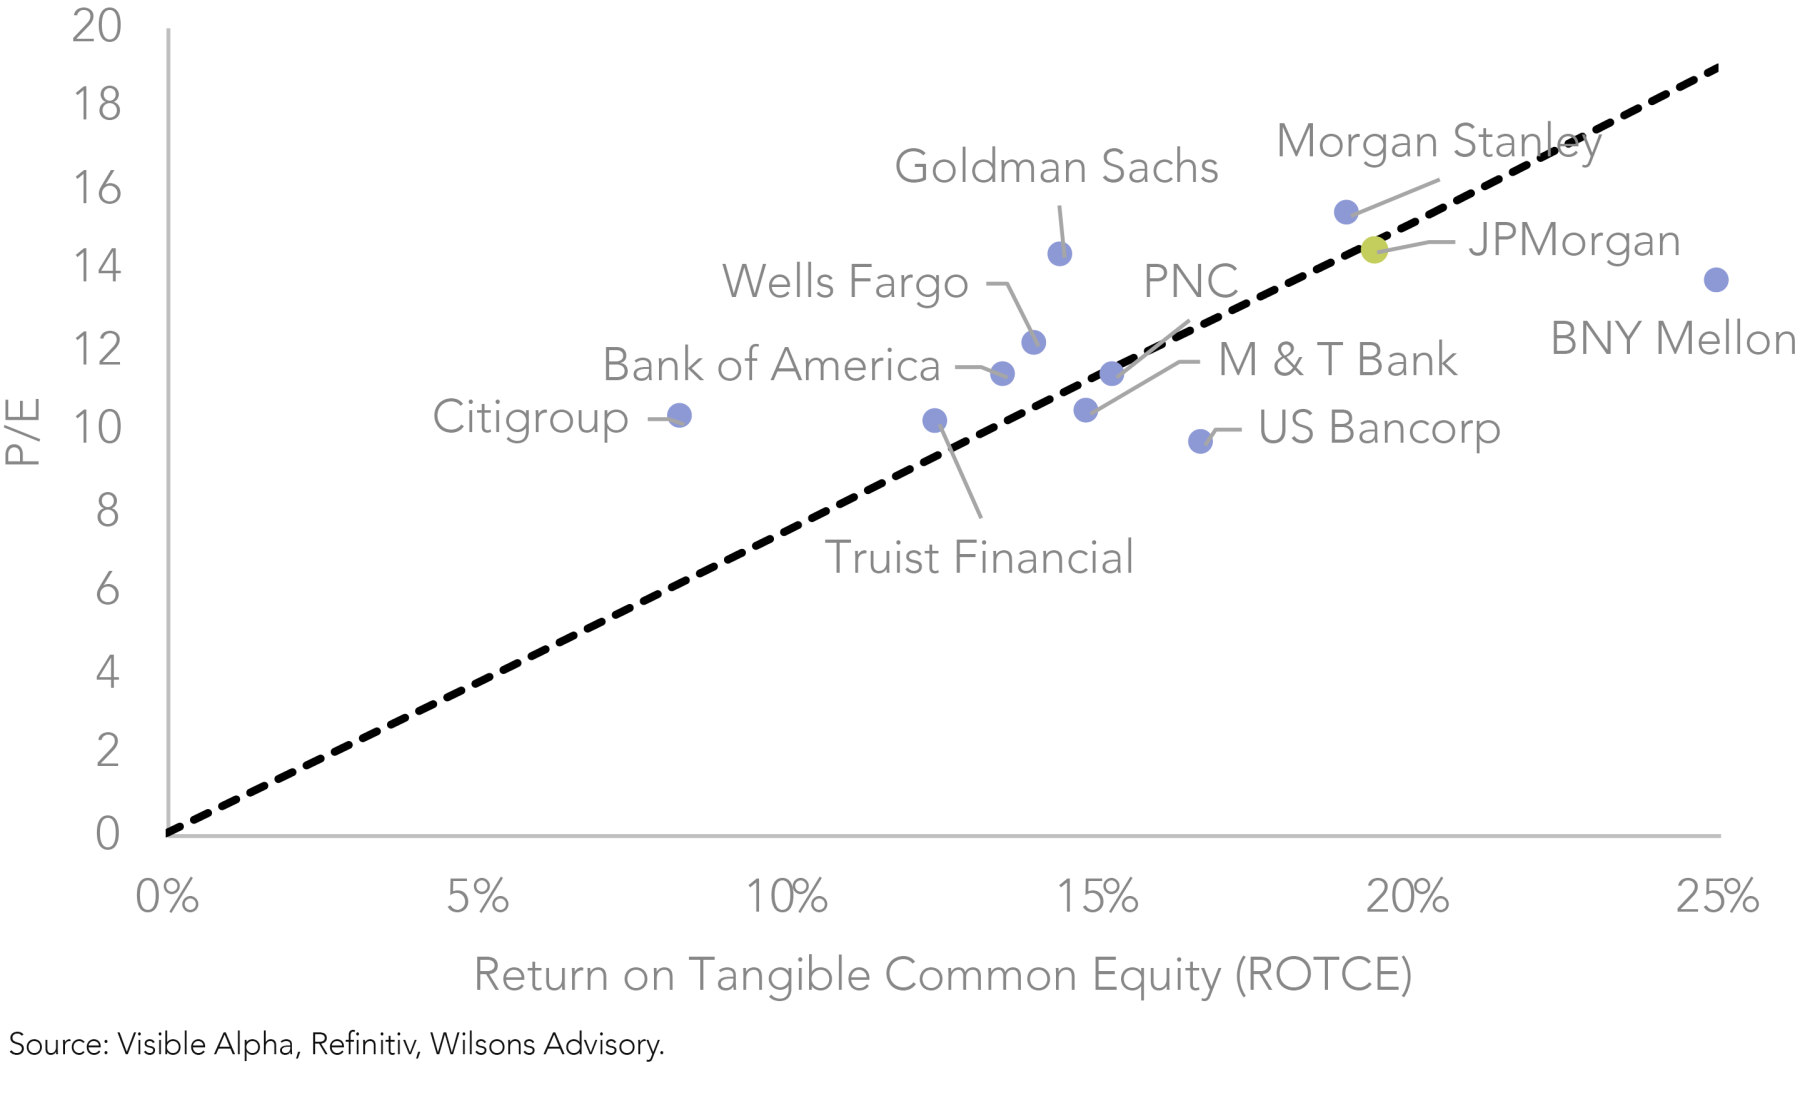
From a sector perspective, Communications and Financials have seen the most significant upgrades to 2025 earnings expectations since reporting began. This strength has played a key role in the broader upward revisions to the market’s earnings growth. This report will provide further analysis of the Financials sector's strong performance this quarter, including recent addition JPMorgan.
Mixed results in the Global Equity Opportunities List this reporting season
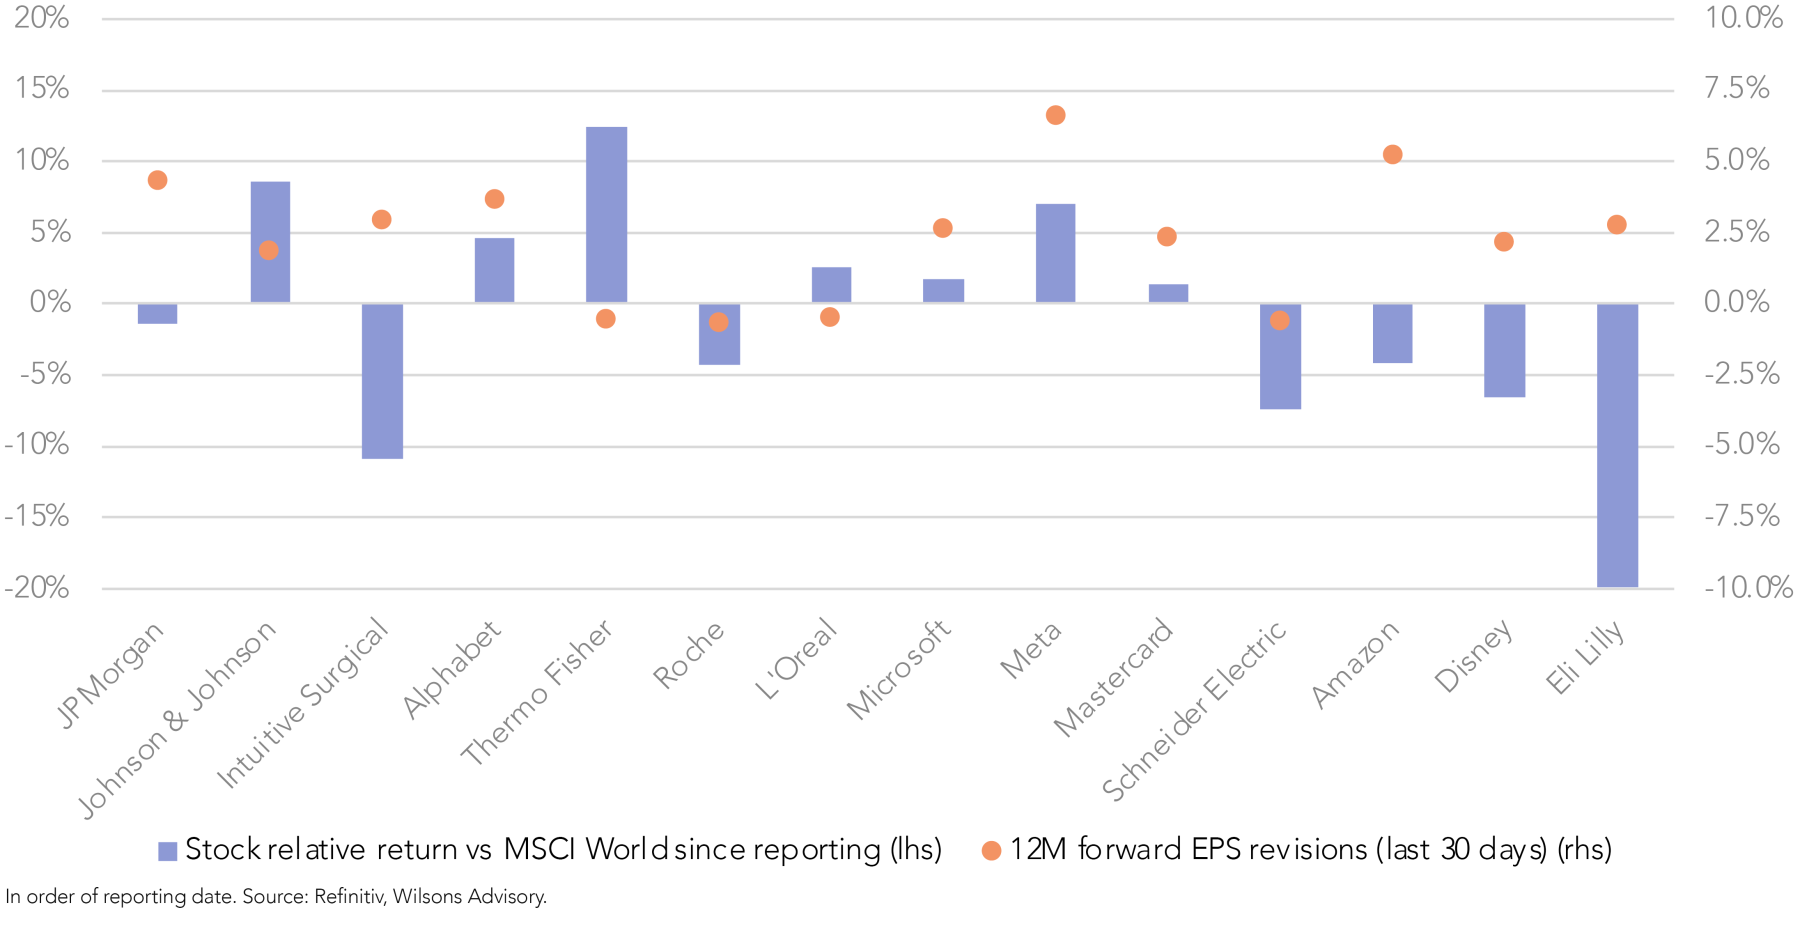
The performance of constituents in the Global Equity Opportunities List has been mixed this reporting season. Thermo Fisher, J&J, Meta and Alphabet have been the standouts, while Schneider Electric and Eli Lilly disappointed. While there has been some share price volatility, Figure 7 shows that there were no material earnings downgrades. We revisit our investment thesis on Eli Lilly later in this report.
Q2 Financial Sector Earnings Have Materially Upgraded Since Reporting Began
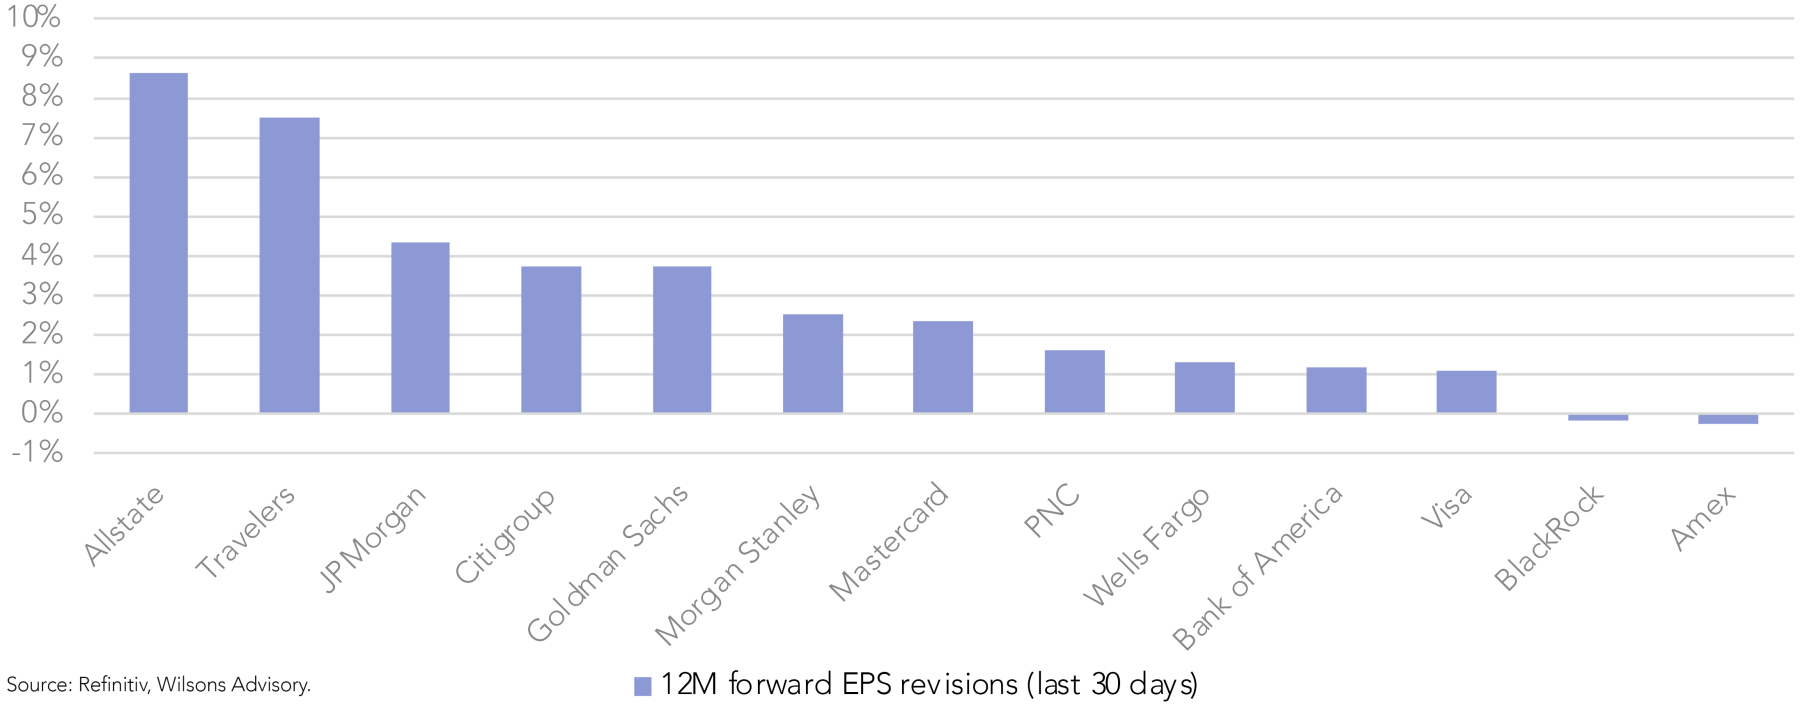
The Financials sector has seen the strongest upgrades against 2Q25 consensus since reporting season began, driven by strong results by the banks and insurers. 2Q25 year-on-year (YoY) earnings growth for the sector is now 13.1%, well above the 2.3% estimated on June 30. The sector’s forward earnings has also been revised upwards, which has been led by JPMorgan.
Trading revenue and investment banking activity were also strong at Citigroup, Morgan Stanley, and Goldman Sachs, while insurers saw upgrades – Allstate benefited from improved underlying margins while Travelers saw strong underwriting growth.
Recent addition JPMorgan’s strong result was driven by Investment Banking
JPMorgan delivered a strong result, beating both top and bottom-line (diluted EPS $5.24 vs $4.46 expected) estimates, driven by its Corporate & Investment Bank division. Investment banking fees rose 7% YoY to $2.51 billion, 20% above consensus expectations, which was underpinned by a rebound in debt underwriting activity. Its Markets business, also within the same broader division, also performed strongly – principal transactions revenue of $7.1 billion was 13% above expectations. JPMorgan raised its full-year net interest income guidance by $1 billion to $95.5 billion. CEO Jamie Dimon noted that the US economy remains resilient, supported by tax reform and potential deregulation.
Eli Lilly – Remaining Positive Despite Disappointing Trial Outcome
Although Eli Lilly reported strong results – including a beat and upgrade – its shares sold off -15% due to weaker-than-expected data from its obesity pill (orforglipron) phase 3 trial (ATTAIN-1). Despite trial results falling short of expectations (12.4% weight loss vs mid-teens expectations), we still remain sanguine about its prospects. Although this is short of the efficacy of injectable GLP-1s, 12.4% is still a meaningful weight loss outcome for a drug that is well-tolerated.
While its lower efficacy will limit its pricing strategies and peak sales outlook, we believe it will still gain solid market penetration given the aversion to needles.
ATTAIN-1 trial aside, Eli Lilly posted a stellar 2Q25 result, with revenue and operating income beating expectations by 5.4% and 11.9%, respectively, which was driven by its GLP-1 franchise (Zepbound and Mounjaro revenue beat expectations by 12% and 10%, respectively), resulting in a full year guidance upgrade. With its injectable GLP-1 franchise continuing to outperform, with prospects for its obesity pill still remaining solid (rather than strong), we see this sell-off as an attractive entry point for a company offering a 5 year EPS CAGR of over 30%, trading at a forward P/E of just 23x.
Meta – AI Monetisation Making A Lasting Impression
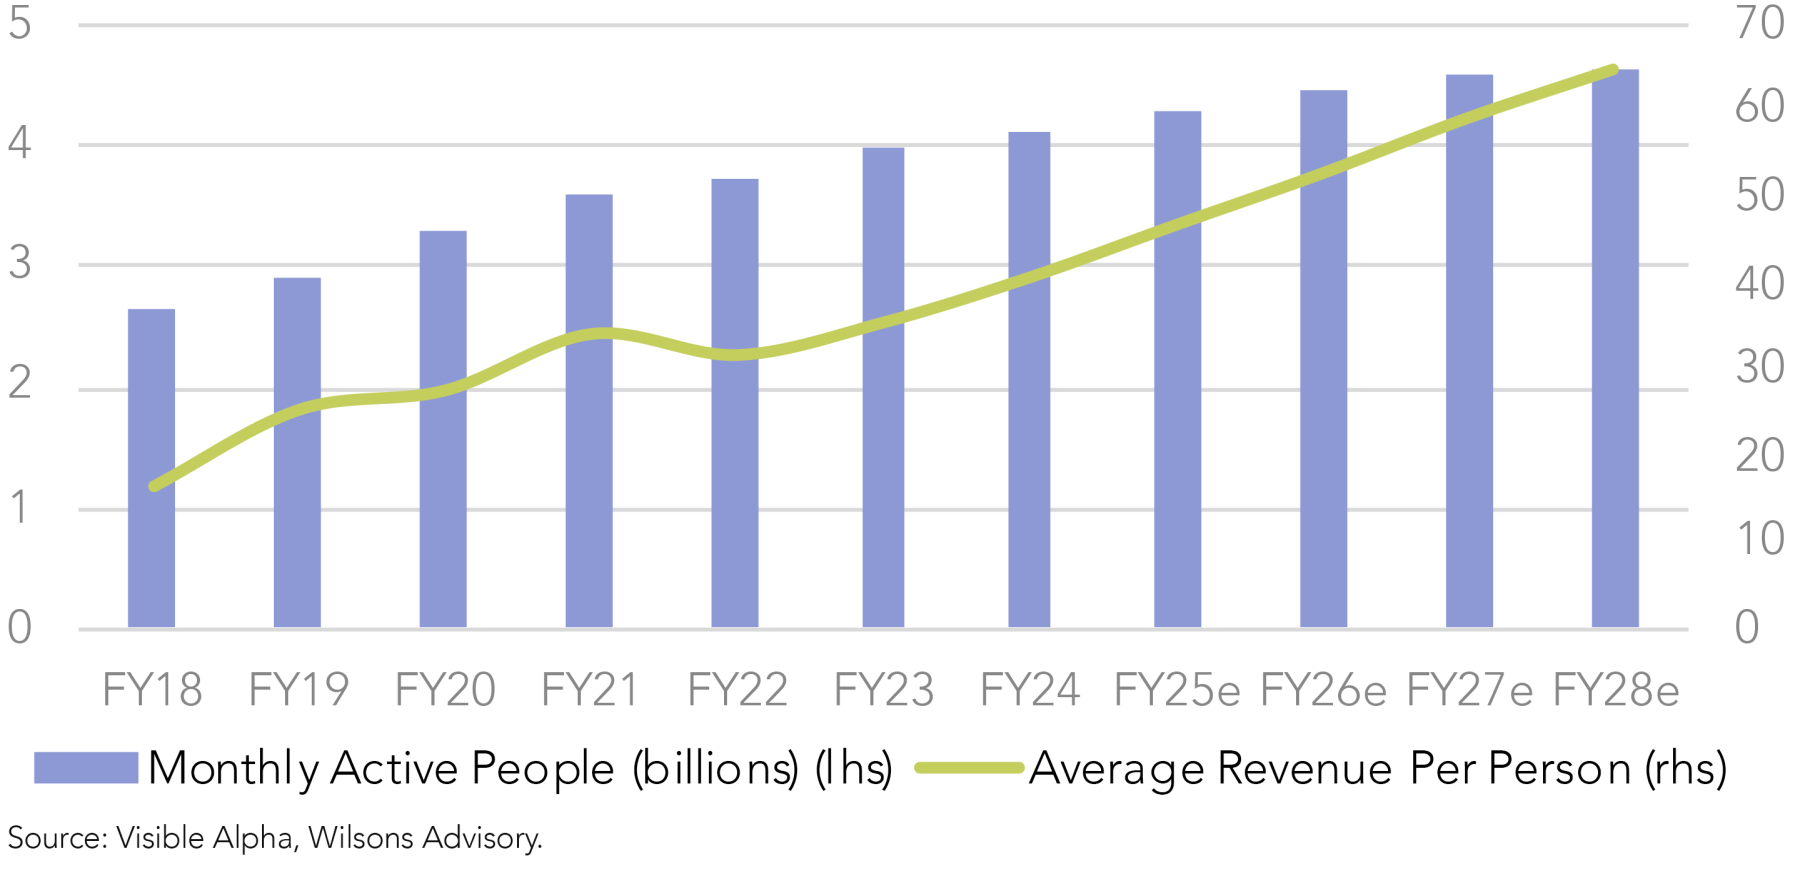
Meta Platforms is a leading global technology company operating two main divisions: its core Family of Apps (FoA) and Digital Reality. Nearly 98% of Meta’s revenue is derived from digital advertising across the FoA ecosystem of over 4 billion monthly active users across Facebook, Instagram, WhatsApp, Messenger and Threads. Digital Reality is focused on the metaverse, augmented reality and virtual reality.
As the digital advertising landscape evolves, Meta’s position as a dominant player, coupled with aggressive AI integration, creates a compelling long-term investment opportunity, underlined by the following four thesis points:
- Its strong competitive advantages are enduring
- AI is improving monetisation opportunities
- Its strategy to capture a larger share of the advertising value chain
- Strong EPS growth supported by an attractive valuation
1. Meta’s enduring moat – scale, brand, data and network effects
Meta’s competitive advantages are deeply entrenched and create one of the most durable moats in the technology sector. Its FoA collectively connect over 4 billion users each month. To put this in context, around 5 billion people globally have internet access, meaning Meta’s apps reach over 80% of the internet population. This scale results in an extraordinarily powerful network effect that is difficult to for a new entrant to replicate (although it is not impossible i.e. TikTok). Due to the scale of interconnected social networks where users have invested years building social connections on these platforms, switching rates are low.
Complementing its network effect, Meta possesses some of the world’s strongest consumer brands. Its apps are globally recognised, which helps reduce marketing costs and enhances user retention. Furthermore, advertisers rely on Meta’s extensive historical data accumulated over many years to target audiences precisely, optimise campaigns, and measure results effectively. This data-driven advantage is difficult to match and supports a sticky relationship between advertisers and the platform.
This combination of network effects, brand strength, low switching costs and scale creates a self-reinforcing competitive moat that continues to protect Meta’s market position.
2. Enhanced monetisation powered by AI
Meta’s monetisation engine is being significantly strengthened by the rapid adoption of its AI-powered advertising tools. Products like Advantage+ are transforming campaign efficiency by automating ad creation, targeting, budgeting and placement. This not only reduces the operational burden on advertisers but also delivers meaningful performance gains. Campaigns typically see a 20-30% improvement in ad ROI compared to manually managed alternatives, prompting advertisers to increase budgets and extend campaign durations on Meta’s platforms.
Meta’s implementation of advanced tools such as Andromeda and Lattice further amplifies results. For example, Andromeda generates and tests billions of ad variations in real time to enhance personalisation and drive higher conversion rates. Lattice, which unifies inventory across Meta’s ecosystem, identifies high-performing patterns that maximise yield on every impression.
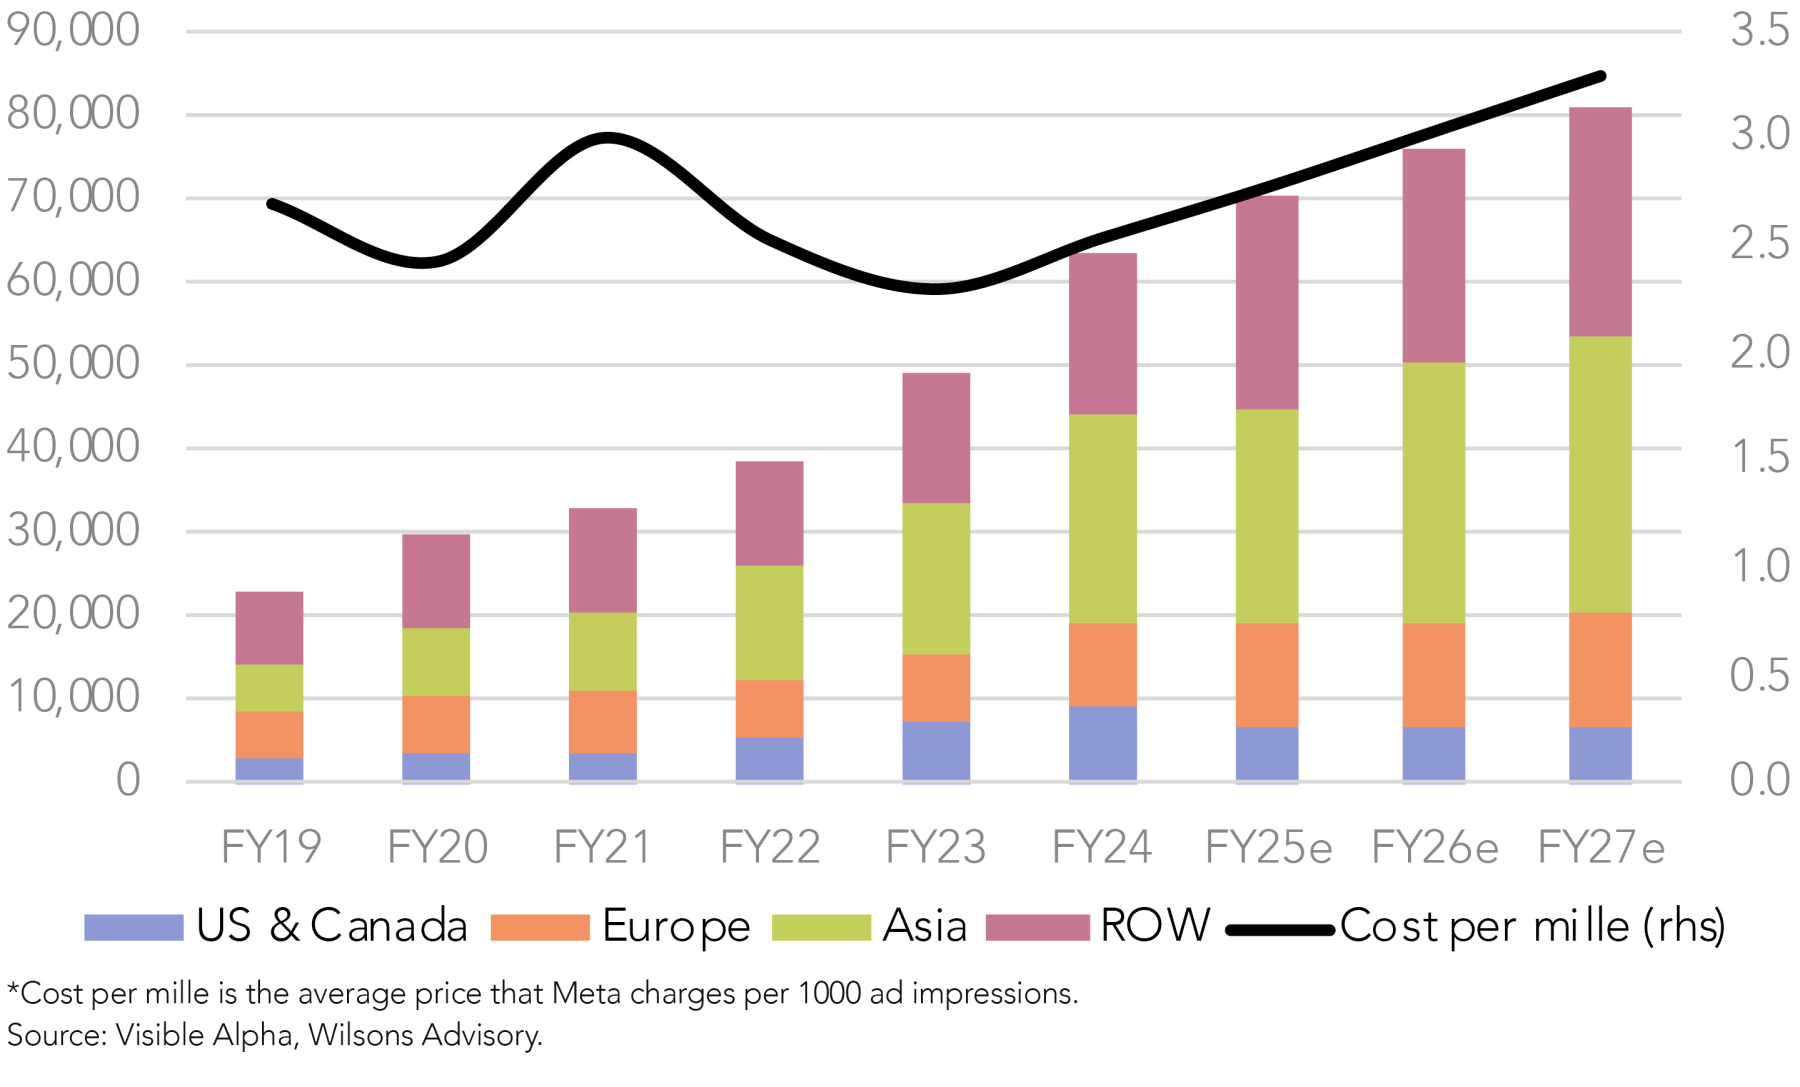
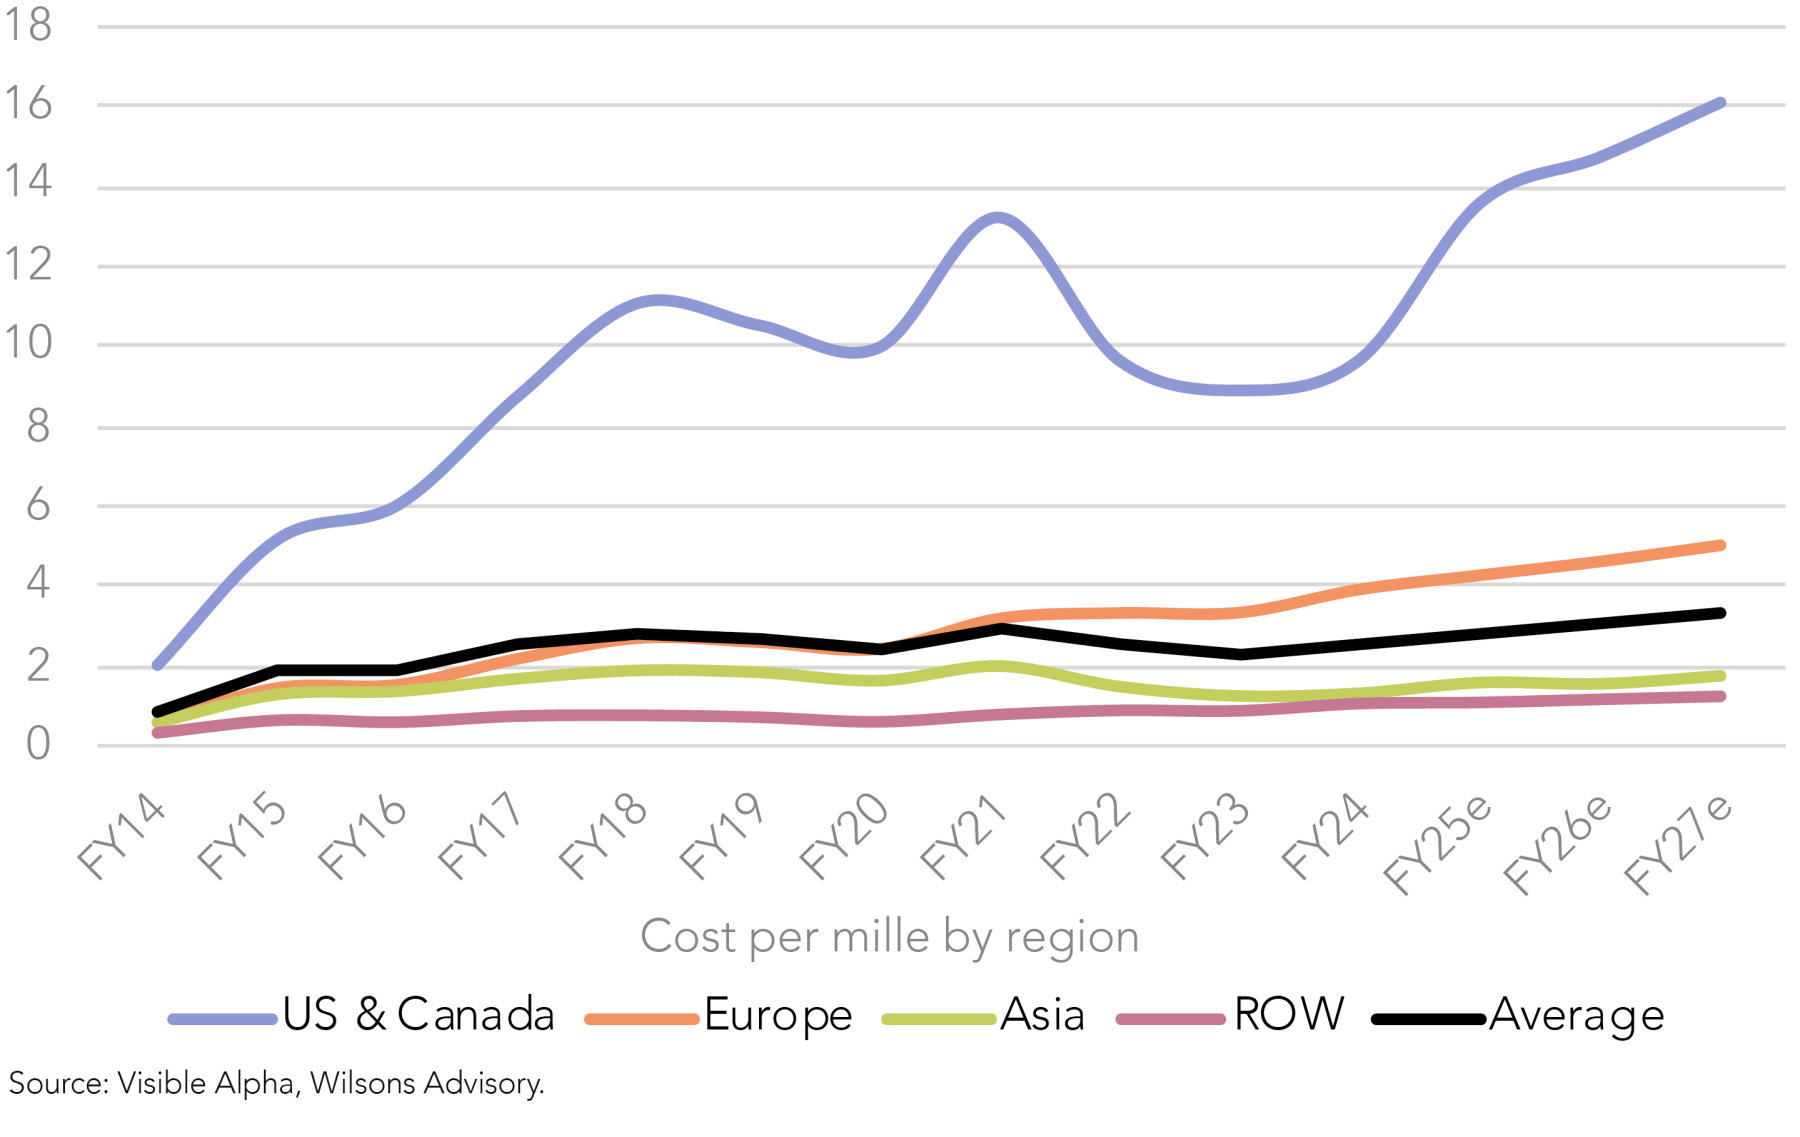
As advertisers see stronger returns, Meta is enhancing its pricing power by demonstrating that its products deliver superior ad ROI, justifying higher ad spend. Over the past year, average ad prices have increased by low-teens percentages. Combined with growing impression volumes, these AI-driven enhancements are accelerating revenue growth and expanding margins beyond that of its mid-single digits active users growth.
3. Strategy to capture a larger share of the advertising value chain
Meta is strategically repositioning itself to capture a greater share of the advertising value chain by evolving from a publisher into a full-stack, AI-powered ad platform. Its goal is to offer end-to-end automated ad generation by 2026, enabling it to expand its role beyond that of just an ad publisher to directly competing with creative agencies, media buyers, and third-party ad tech providers.
This transition is powered by generative AI and large language models that can rapidly produce ad creatives, tailor messaging in real time and continuously optimise performance. By reducing the complexity and cost associated with traditional ad development, Meta aims to become a one-stop shop for digital marketing. By absorbing upstream functions traditionally handled by external agencies, Meta is positioned to capture a larger portion of company advertising budgets. This will expand its total addressable market within digital media and enhance its operating leverage.
4. Attractive P/E given its solid earnings growth
Meta’s earnings growth is supported by healthy growth backdrop in digital advertising, its exposure to higher-growth segments, market share gains and margin expansion opportunities.
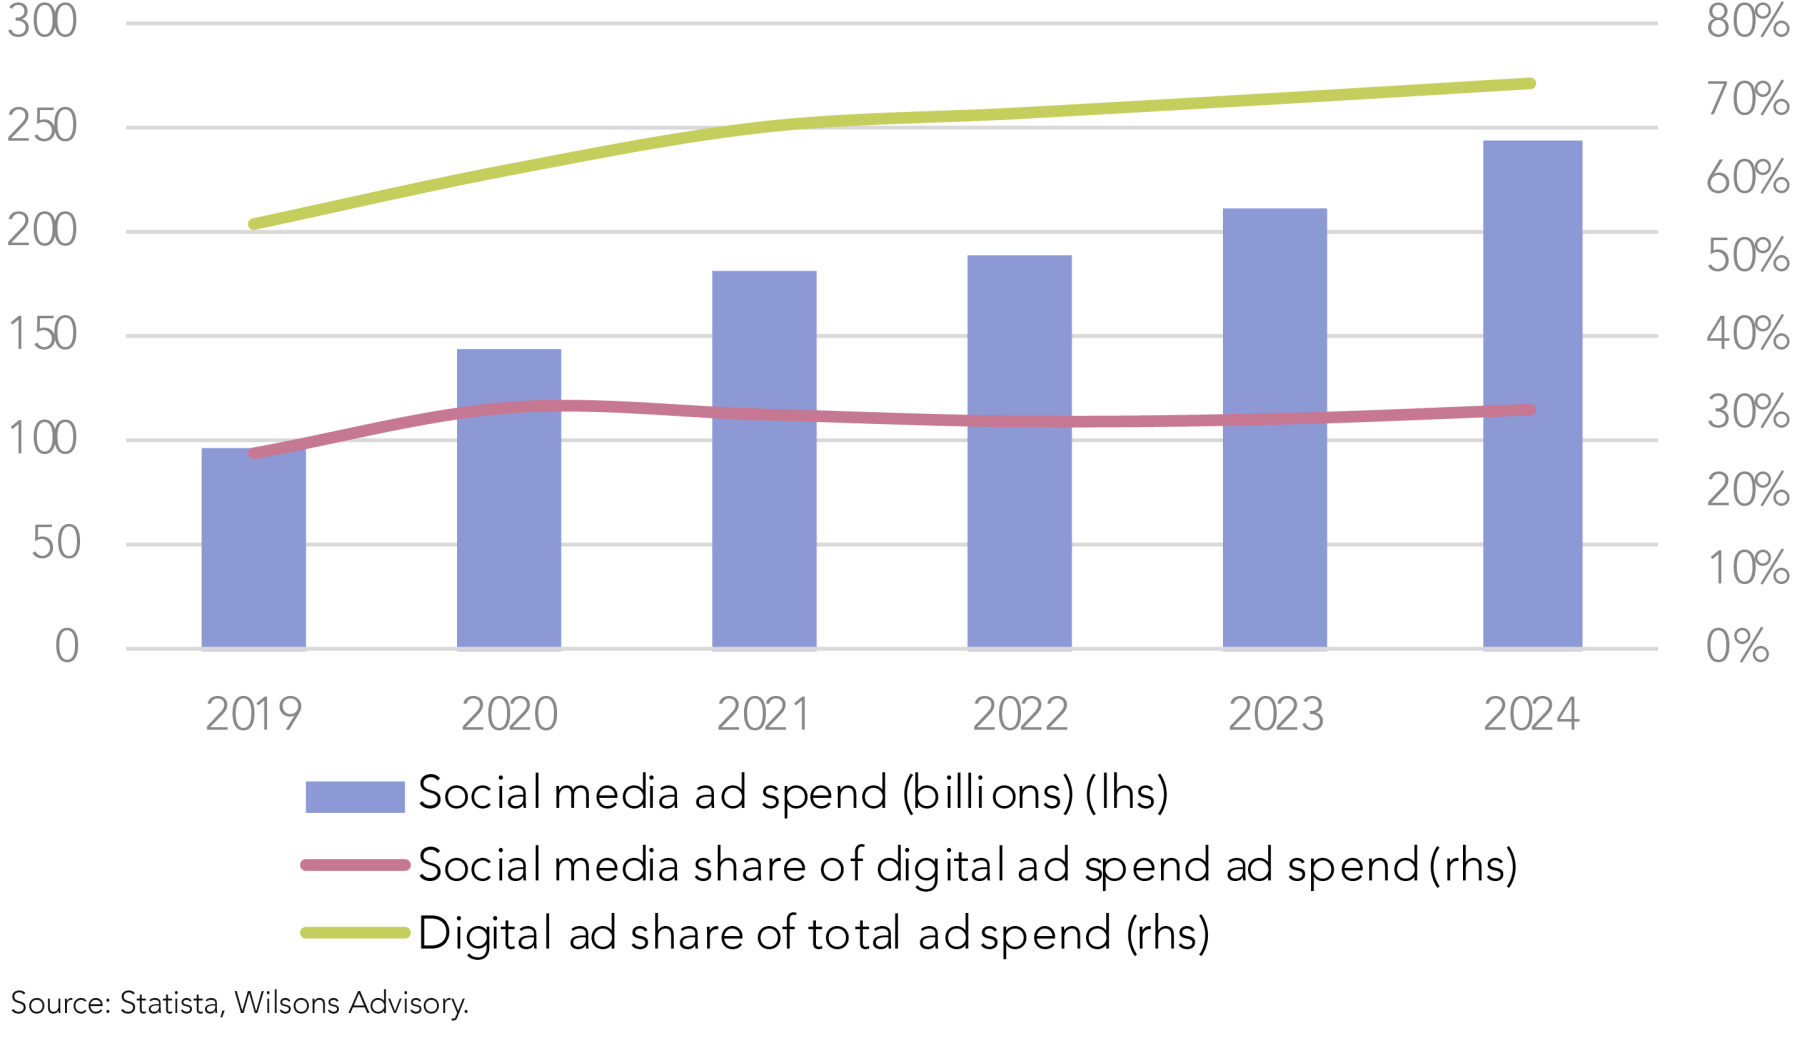
The global digital ad market is forecast to grow at high single-digit (HSD) rates in the medium-term, while Meta exposed to the higher-growth segments within digital advertising, with both social media ads and digital video ads growing faster than search ads.
In addition, Meta’s enhanced offerings (i.e. improved user engagement, ad placement and targeting) from AI should incrementally increase market share, while also improving pricing power as higher ad ROIs justify price rises. This, combined with HSD industry growth, supports low-to-mid teens earnings growth.
With Mark Zuckerberg stating that 2025 is a crucial year for Digital Reality, we believe there is a possibility that the CEO will announce a pullback in spending in its metaverse division, which still isn’t performing. This will be welcome news, as this division is losing ~$20 billion a year, resulting in the company underearning by ~20%. Stemming losses in this division through cost cutting would further boost growth projects and support medium-term EPS growth of mid-to-high teens, in combination with the aforementioned factors.
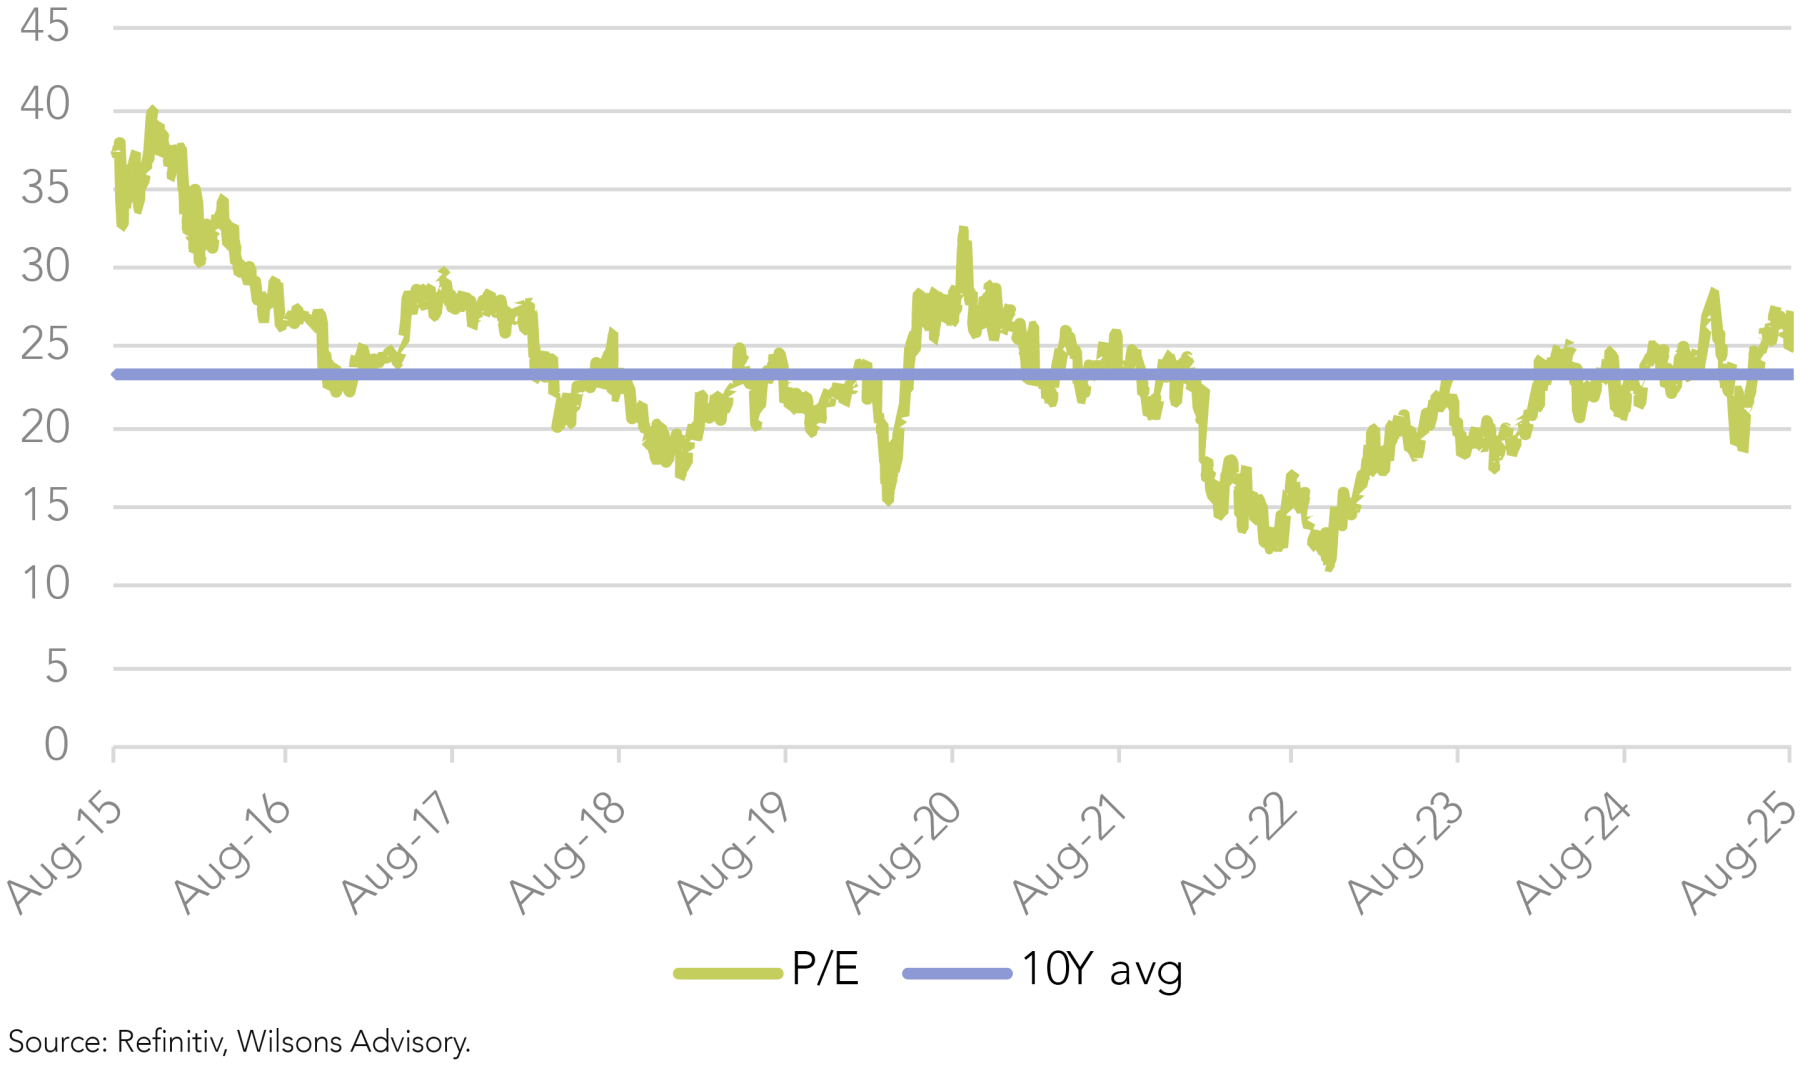
Meta currently trades at a forward P/E of 26x, which is an attractive multiple for a high-quality mega cap with low-to-high teens earnings growth (depending on a range of scenarios) that is experiencing genuine AI tailwinds, presenting is a compelling investment opportunity.
| Company Name | 12 mth fwd PE | EPS CAGR (FY26-27) | Investment summary |
| Communication Services | |||
| Alphabet | 19.4 | 10% | Google has a very wide moat giving rise to its place as the overwhelmingly dominant leader in search. The business is still in the middle stages of the structural transition to digital advertising globally. Long-term growth will also be driven by its cloud and hardware businesses. |
| Disney | 17.5 | 11% | Global integrated entertainment business with a great portfolio of businesses centred on its streaming operations (i.e. Disney +, Hulu, ESPN+), as well as its cable networks and its strong mix of film studios. Key moats include its brand, scale and extensive IP. |
| Meta | 26.2 | 10% | Meta Platforms is a global technology company that connects users online, with a user base of over 4 billion. It generates ~98% of revenue from advertising across Facebook, Instagram, WhatsApp and Messenger and is utilising AI to enhance its advertising capabilities. |
| Tencent | 17.7 | 12% | Chinese internet giant with an ever-expanding ecosystem that provides key services in social networking, gaming, media and entertainment, payments and cloud computing. Tencent benefits from its network effects, customer lock in, and significant IP. |
| Consumer Discretionary | |||
| Amazon.com | 30.5 | 19% | Amazon is the world's dominant player in both ecommerce and cloud infrastructure services (via AWS), which should continue to deliver significant long-term structural growth opportunities for the business - particularly in cloud. |
| Home Depot | 24.6 | 9% | The world's largest home improvement retailer. Over the medium-term, strong earnings growth should be underpinned by continued market share gains and looming US interest rate cuts. |
| Consumer Staples | |||
| L'Oreal | 28.5 | 8% | L’Oréal is the world's preeminent beauty player, with exposure to a range of categories (skin care, makeup, hair and perfume) and channels (mass, prestige, salon and pharmacy) and a proven track record of growing both organically and via acquisitions. |
| Walmart | 37.1 | 12% | Walmart is the largest retailer in the world with a focus on price leadership and convenience. After years of investments into its physical/digital assets, the business is positioned to win an ever-larger share of US consumer spending, with higher sales leveraged across the company’s asset base likely to benefit margins over time. |
| Financials | |||
| JPMorgan Chase | 14.4 | 6% | JPMorgan Chase is the largest US bank by assets, offering investors a compelling long-term opportunity through its diversified revenue streams, strong balance sheet, consistent capital returns, best-in-class management and market leadership in commercial banking, investment banking, and wealth management. |
| Mastercard | 31.7 | 16% | Dominant #2 player (after Visa) in the global card payments industry which is a functioning duopoly. Significant competitive advantages include its vast network effect, its large scale, strong brand, innovative tech and the significant regulatory barriers to entry. |
| Healthcare | |||
| Eli Lilly | 22.8 | 29% | Global pharma leader with a market leading position in GLP-1 weight loss drugs. The increasing penetration of GLP-1 drugs globally will drive significant earnings growth for LLY over the medium and long-term. |
| Intuitive Surgical | 52.8 | 15% | World leader in the manufacture of robot assisted surgery systems, with an entrenched market position and an extensive IP portfolio. Future earnings will be driven by overall organic growth in surgical procedures and rising penetration of robotic surgery. |
| Johnson & Johnson | 15.5 | 6% | A dominant global healthcare player with a range of products across consumer healthcare, medical devices, and diagnostics & pharmaceuticals. The largest division is pharmaceuticals, which has a number of products in the pipeline to drive medium-term growth. |
| Roche | 12 | 5% | Roche is a global pharmaceutical leader that produces prescription drugs in the areas of oncology, immunology and infectious diseases. The company’s R&D focus positions it to transform its extensive knowledge of disease biology into new treatments, providing significant growth potential if upcoming pipeline candidates are successful. |
| Thermo Fisher Scientific | 19.4 | 9% | #1 life sciences company in the world by some margin, with a relatively balanced exposure to the pharmaceutical, diagnostics, industrial, and academic end-markets. Has benefitted from the strong ongoing tailwinds driving increase pharmaceutical and biotech R&D spending. |
| Industrials | |||
| Schneider Electric | 23.1 | 13% | World leading electrical equipment company with exposure to significant structural growth tailwinds from the Decarbonisation and Artificial Intelligence thematics. |
| Information Technology | |||
| Adobe | 15.1 | 13% | Dominant digital media and marketing software business with a comprehensive suite of industry leading software products, a strong network effect and high switching costs. |
| Microsoft | 32.7 | 18% | Leading maker of enterprise and consumer software. Enjoys a wide moat from its high switching costs and the widespread use and close integration between the products in its network. Growth will be driven by the cloud business as Azure scales up rapidly. |
| NVIDIA | 34.6 | 25% | World leader in the design and manufacturing of semiconductors used for graphics and other computationally intensive workloads. Continued growth will be driven by the increased need for computing power to support rapid technological advancement. |
| Salesforce | 19.9 | 13% | Salesforce is a pioneer in SaaS and a global leader in CRM technology. The business continues to gain share as it builds out its suite of integrated products and platforms, while the industry is growing at ~20% p.a. as the world becomes more digital. |
Source: Refinitiv, Wilsons Advisory.

Written by
Greg Burke, Equity Strategist
Greg is an Equity Strategist in the Investment Strategy team at Wilsons Advisory. He is the lead portfolio manager of the Wilsons Advisory Australian Equity Focus Portfolio and is responsible for the ongoing management of the Global Equity Opportunities List.
About Wilsons Advisory: Wilsons Advisory is a financial advisory firm focused on delivering strategic and investment advice for people with ambition – whether they be a private investor, corporate, fund manager or global institution. Its client-first, whole of firm approach allows Wilsons Advisory to partner with clients for the long-term and provide the wide range of financial and advisory services they may require throughout their financial future. Wilsons Advisory is staff-owned and has offices across Australia.
Disclaimer: This communication has been prepared by Wilsons Advisory and Stockbroking Limited (ACN 010 529 665; AFSL 238375) and/or Wilsons Corporate Finance Limited (ACN 057 547 323; AFSL 238383) (collectively “Wilsons Advisory”). It is being supplied to you solely for your information and no action should be taken on the basis of or in reliance on this communication. To the extent that any information prepared by Wilsons Advisory contains a financial product advice, it is general advice only and has been prepared by Wilsons Advisory without reference to your objectives, financial situation or needs. You should consider the appropriateness of the advice in light of your own objectives, financial situation and needs before following or relying on the advice. You should also obtain a copy of, and consider, any relevant disclosure document before making any decision to acquire or dispose of a financial product. Wilsons Advisory's Financial Services Guide is available at wilsonsadvisory.com.au/disclosures.
All investments carry risk. Different investment strategies can carry different levels of risk, depending on the assets that make up that strategy. The value of investments and the level of returns will vary. Future returns may differ from past returns and past performance is not a reliable guide to future performance. On that basis, any advice should not be relied on to make any investment decisions without first consulting with your financial adviser. If you do not currently have an adviser, please contact us and we would be happy to connect you with a Wilsons Advisory representative.
To the extent that any specific documents or products are referred to, please also ensure that you obtain the relevant disclosure documents such as Product Disclosure Statement(s), Prospectus(es) and Investment Program(s) before considering any related investments.
Wilsons Advisory and their associates may have received and may continue to receive fees from any company or companies referred to in this communication (the “Companies”) in relation to corporate advisory, underwriting or other professional investment services. Please see relevant Wilsons Advisory disclosures at www.wilsonsadvisory.com.au/disclosures.
